Ethereum is unable to regain the strength it demonstrated in the early hours of 2024. If the fundamentals of the project remain solid, doubt continues to creep in among market operators. The lackluster launch of spot ETH ETFs in the United States did not create the long-awaited buying pressure. What phase is ETH in now?
It is Friday October 4, 2024 and the price of ETH is moving around $2,400.
Many investors are still patiently waiting for renewed strength in the Ethereum cryptocurrency. If ETH does not regain relative strength against BTC and other altcoins, the charts show some signs of resilience.
Eternal second in the ranking of cryptocurrencies, with 287 billion dollars in market capitalization, the Ethereum project nevertheless seems to attract less attention from investors. So, where are we technically on the ETH token?
Cryptoast Academy: Don’t waste this bull run, surround yourself with experts
| Pairs with Ethereum | 24 hours | 7 days | 1 month |
| Ethereum/USDT | +1.40% | -10.80% | -0.70% |
| Ethereum/Bitcoin | +0.10% | -4.40% | -8.30% |
👉 How to easily buy Ethereum (ETH) in 2024?
Ethereum: start of bullish reconstruction on relative strength?
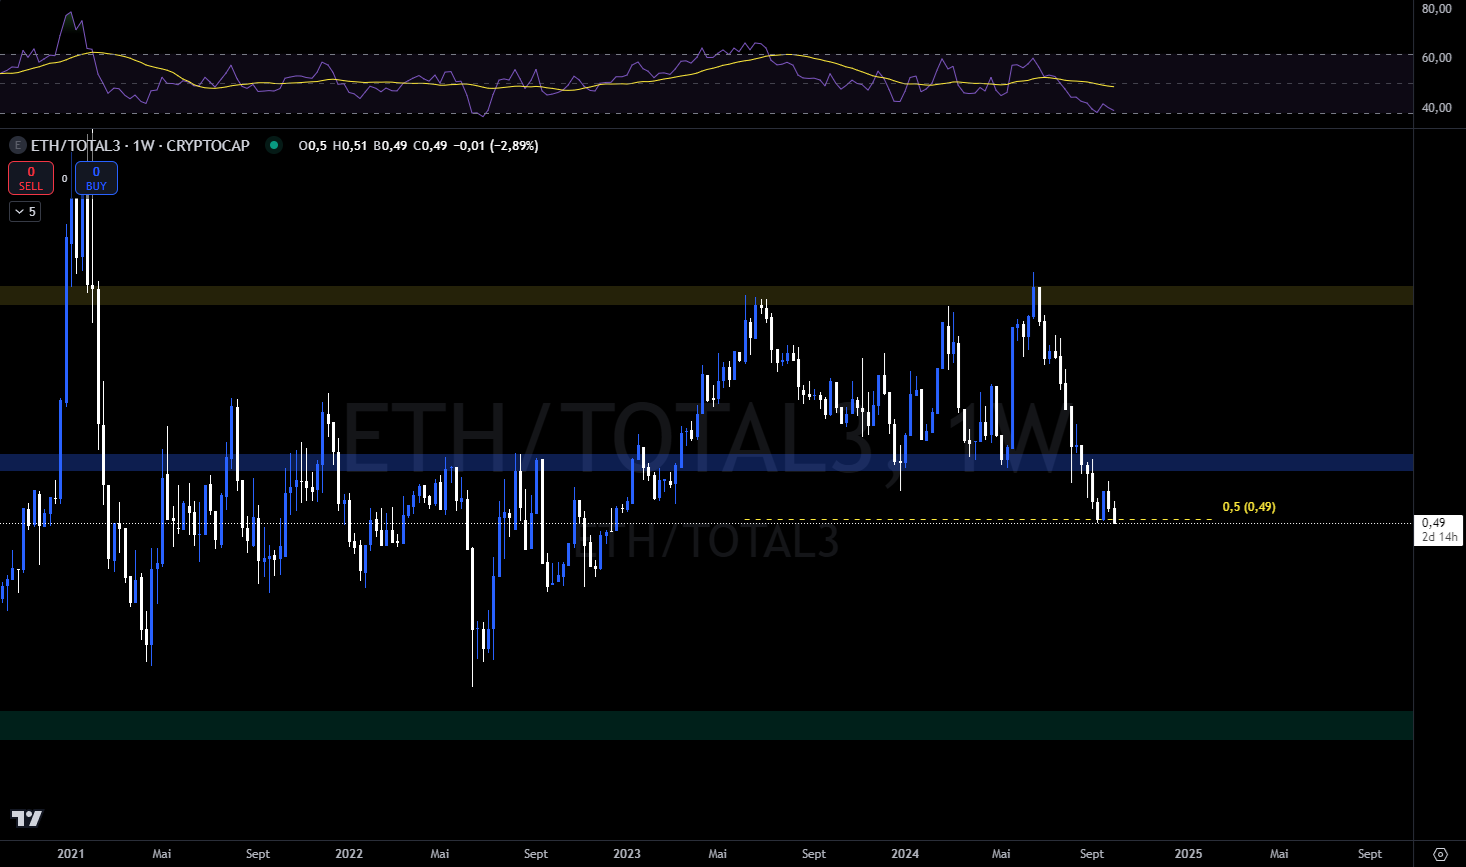
The first reaction that we observed last week was not enough to allow Ethereum to restart in the direction of outperformance against altcoins.
If the Relative Strength Index (RSI) shows an interesting signal on its support zone, with a notable slowdown in momentum in a context where the ETH/TOTAL3 pair continues to make lower lows, it could miss a final excess before rebuilding at the rise.
On the contrary, in the event of a rebound in Ethereum, a recovery scenario would first consist of crossing last week’s highs to prepare for crossing the zone drawn in blue.

Chart of Ethereum against TOTAL3 weekly
Buy cryptos on eToro
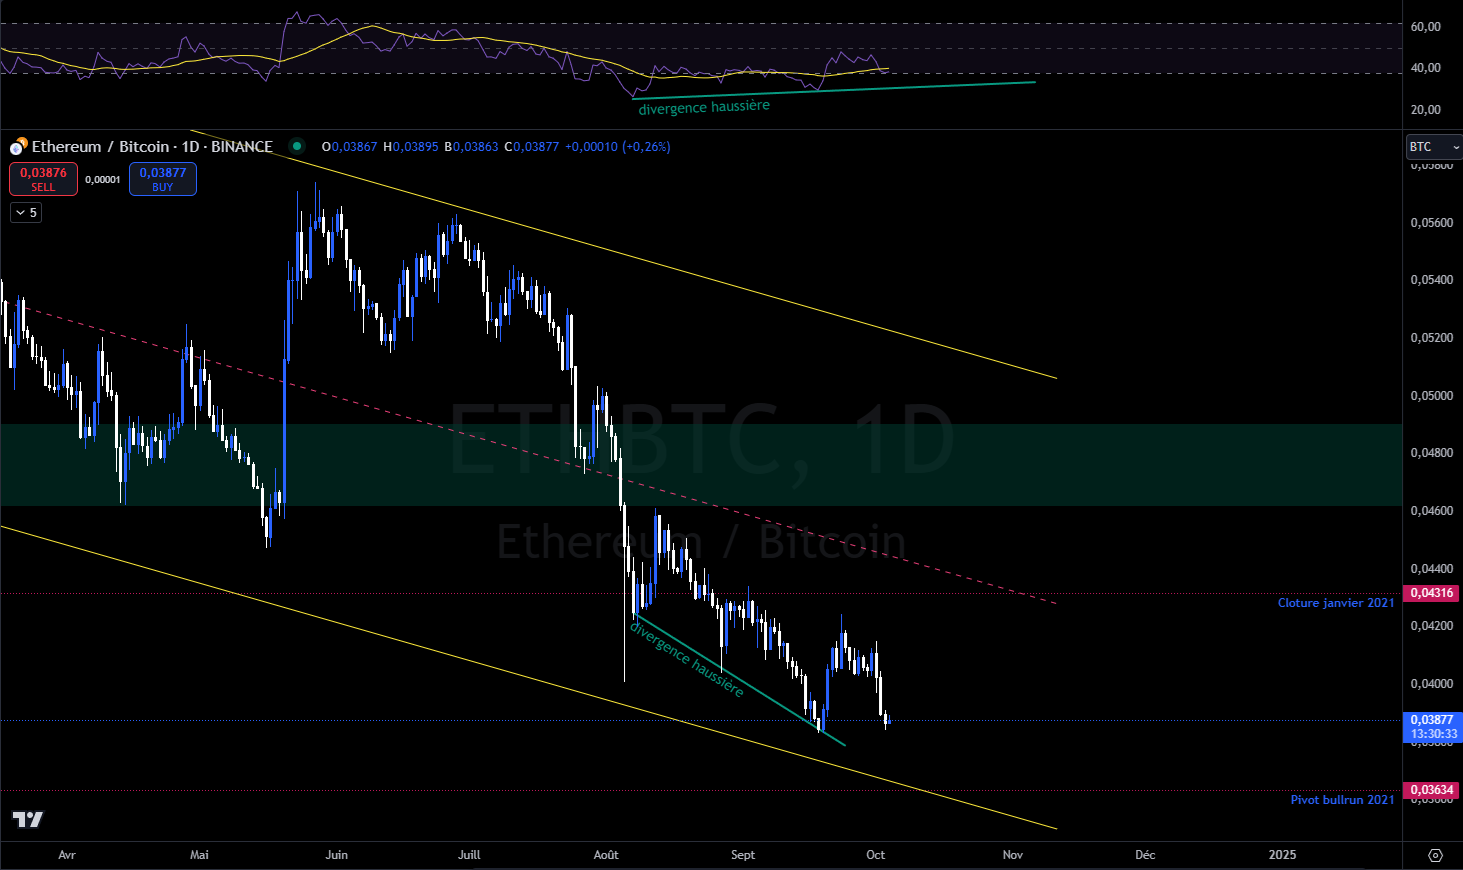
Against Bitcointhe trend remains bearish, still part of a long-term channel. The mid-September divergence has been confirmed but it does not allow prices to reach a new high point.
In the idea of a bullish reconstruction, the chart must maintain the RSI trend in support, which would give free rein to new lows in divergence. In the event of a rebound on these levels, maintaining the RSI in the neutral zone could also show good signals, particularly if the latter manages to resume its moving average.

Ethereum vs. Bitcoin Daily Chart
Buy cryptos on eToro
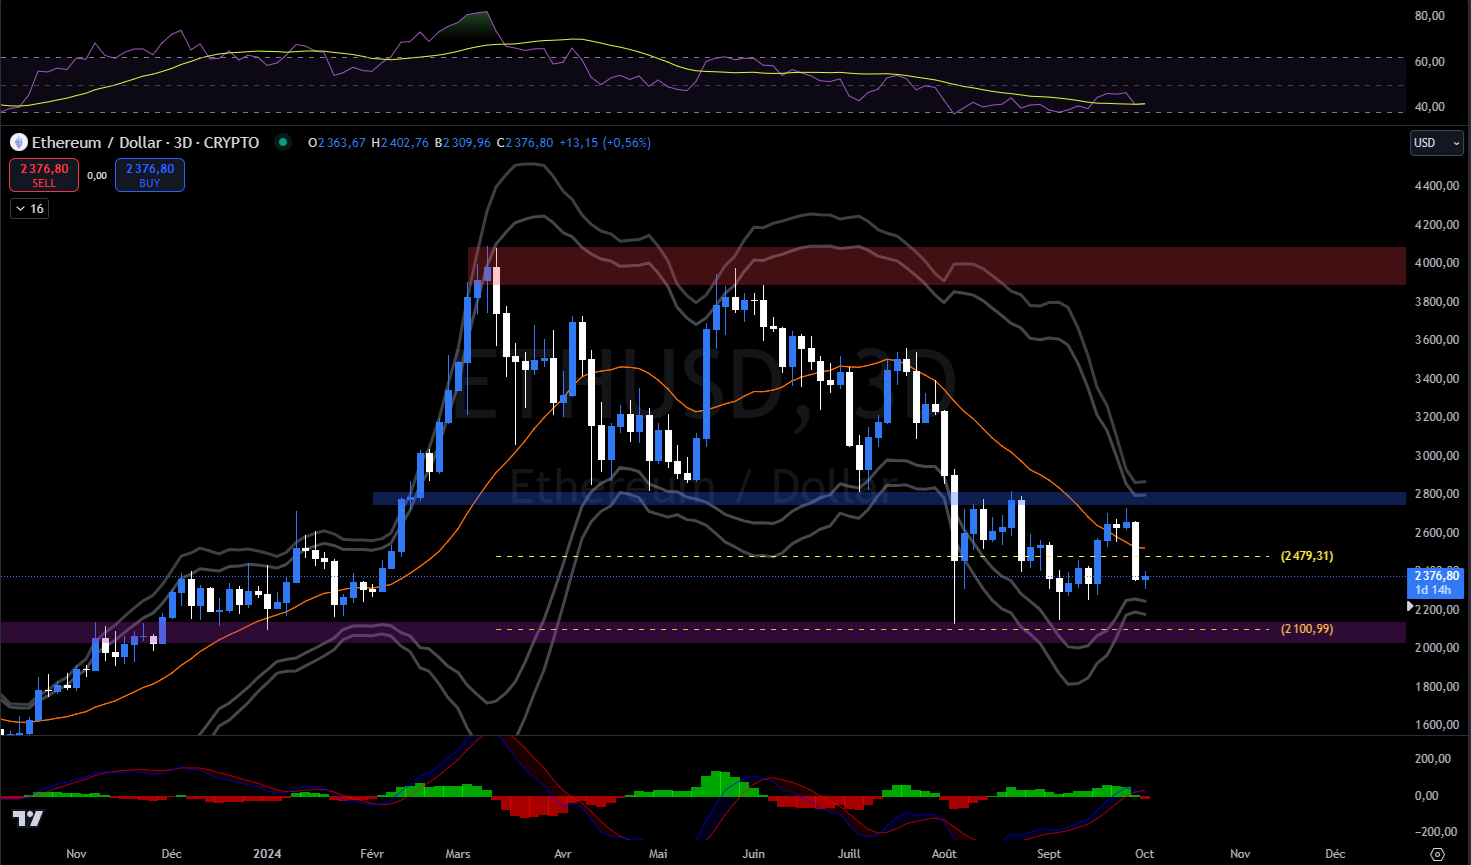
ETH, ranges between $2,100 and $2,800
Ethereum failed to cross $2,800, an area we had anticipated to be very strong. In view of the 2 powerful levels which oppose each other between 2,100 and 2,800 dollars, the probability of a lateralization in this range, the time to prepare the next movement, is very strong.
The 3-day Bollinger Bands confirm this scenario as they are now closed, and the 20-day moving average is approaching convergence with the range equilibrium we have just described.
This level, located around $2,500, is also the 50% retracement of the entire bullish wave from bear market lows. The framework for ETH is therefore clear, with a polarity zone located between $2,450 and $2,550.
While any development of range price action often presents downward or upward traps before re-entering towards the opposite boundary, it is the final exit from this zone that should determine the direction of the next movement.
Given the underlying trend, the probabilities favor an exit in the direction of the underlying trend, i.e. towards the north. It is nevertheless difficult, in terms of temporality, to anticipate the moment when prices will decide to break free from the range.

ETH price chart in 3 days
In summary, the Ethereum cryptocurrency is in a range between $2,100 and $2,800. The probabilities point to a lateralization phase lasting several weeks before determining the direction of the next movement. That said, given the underlying trend, it could be on an upward trend.
So, do you think ETH can outperform the crypto market again? Don’t hesitate to give us your opinion in the comments.
Have a nice day and we’ll see you next week for a new technical analysis of Ethereum.
Ledger: the best solution to protect your cryptocurrencies 🔒
Sources: Trading ViewCoinglass, GlassnodeETF
The #1 Crypto Newsletter 🍞
Receive a summary of crypto news every day by email 👌
What you need to know about affiliate links. This page may feature investment-related assets, products or services. Some links in this article may be affiliated. This means that if you buy a product or register on a site from this article, our partner pays us a commission. This allows us to continue to offer you original and useful content. There is no harm to you and you can even get a bonus using our links.
Investments in cryptocurrencies are risky. Cryptoast is not responsible for the quality of the products or services presented on this page and cannot be held responsible, directly or indirectly, for any damage or loss caused following the use of a good or service highlighted in this article. Investments related to crypto-assets are risky by nature, readers should do their own research before taking any action and only invest within the limits of their financial capabilities. This article does not constitute investment advice.
AMF recommendations. There is no guaranteed high return, a product with high return potential involves high risk. This risk-taking must be in line with your project, your investment horizon and your capacity to lose part of this savings. Do not invest if you are not prepared to lose all or part of your capital.
