
A binary search tree (BST) is a specific type of data structure in computer science and the binary search tree visualization is an important topic. It is a type of binary tree where each node has at most two children, referred to as the left child and the right child. However, what distinguishes it from a regular binary tree is the property that:
- Every node’s key is greater than all keys in its left child (subtree), and
- Every node’s key is less than all keys in its right child (subtree).
In simpler terms, for each node, all elements in the left subtree are less than the node, and all elements in the right subtree are greater than the node. Now, how to perform a binary search tree visualization?
Overview
There are several tools, libraries, and programming languages that you can use to visualize binary search trees:
- Python Libraries:
MatplotlibandNetworkX: These are Python libraries that can be used together to create and draw graphs, including binary trees.pygraphviz: This is a Python interface to the Graphviz graph layout and visualization package, which can be used for creating, viewing and manipulating graphs and trees.binarytree: This is a Python library specifically designed for generating, visualizing, inspecting, and manipulating binary trees.
- Online Tools:
Lucidchart: An online diagramming tool that you can use to manually create binary search trees.draw.io (also known as diagrams.net): Another online diagramming tool for creating a wide variety of diagrams.VisuAlgo: An online tool that visualizes algorithms and data structures, including binary search trees.
- Desktop Software:
Microsoft Visio: A diagramming tool by Microsoft that can be used to manually create binary search trees.Graphviz: Open-source graph visualization software that can be used to represent structural information, such as binary trees.
- Programming Languages:
Java,C++,JavaScript, etc: With any programming language, you can implement your own code to create a binary search tree and print it out in a console or terminal. You could also use libraries or packages available in these languages to visualize trees.
Display a Tree Manually
A binary search tree (BST) is a specific type of data structure in computer science. It is a type of binary tree where each node has at most two children, referred to as the left child and the right child. However, what distinguishes it from a regular binary tree is the property that:
- Every node’s key is greater than all keys in its left child (subtree), and
- Every node’s key is less than all keys in its right child (subtree).
In simpler terms, for each node, all elements in the left subtree are less than the node, and all elements in the right subtree are greater than the node.
Here’s a very basic example of what a binary search tree might look like:
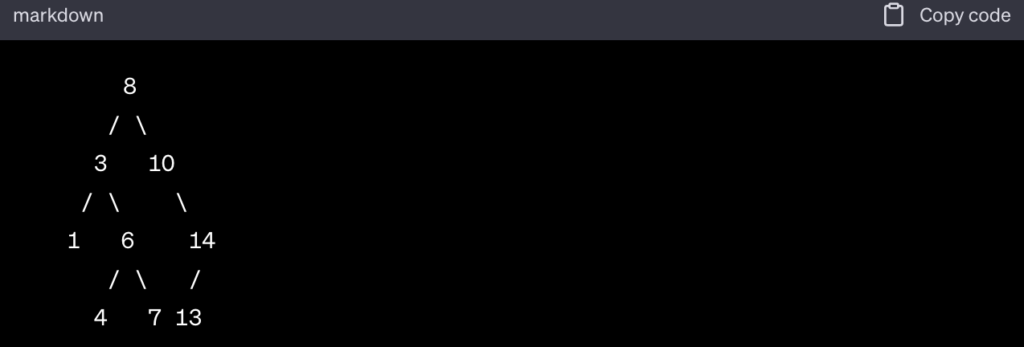
In this tree, every node follows the binary search tree properties. For example, for the root node 8, all the nodes in its left subtree (3, 1, 6, 4, 7) are less than 8, and all the nodes in its right subtree (10, 14, 13) are greater than 8.
Binary search trees are widely used in programming because they are efficient for many operations, like lookup, insertion, and deletion, when the tree is balanced. They are used in many areas of computer science, including database systems and file systems.
Display a Tree With a Python Library
There are several Python libraries that can be used to visualize binary search trees. One of the most commonly used ones is Matplotlib in conjunction with NetworkX. NetworkX is not specifically designed for trees, but since a tree is a special kind of graph, it can be used for this purpose.
Here’s a simple example of how you might use these libraries to get a visualization of a a binary search tree:
import matplotlib.pyplot as plt
import networkx as nx
from networkx.drawing.nx_agraph import graphviz_layout

class Node:
    def __init__(self, data):
        self.data = data
        self.left = None
        self.right = None

def insert(node, data):
    if node is None:
        return Node(data)
    else:
        if data <= node.data:
            node.left = insert(node.left, data)
        else:
            node.right = insert(node.right, data)
    return node

def add_edges(graph, node):
    if node is not None:
        if node.left is not None:
            graph.add_edge(node.data, node.left.data)
            add_edges(graph, node.left)
        if node.right is not None:
            graph.add_edge(node.data, node.right.data)
            add_edges(graph, node.right)

def plot_tree(root):
    graph = nx.DiGraph()
    add_edges(graph, root)
    pos = graphviz_layout(graph, prog='dot')
    nx.draw(graph, pos, with_labels=True, arrows=False)
    plt.show()

# Driver code to test above
root = None
root = insert(root, 8)
insert(root, 3)
insert(root, 6)
insert(root, 1)
insert(root, 10)
insert(root, 14)
insert(root, 13)
insert(root, 4)
insert(root, 7)

plot_tree(root)
Please note that this code uses the pygraphviz library for layout which might need to be installed separately. It can be installed using pip:
pip install pygraphvizAlso note that the above code is quite basic. It only plots the nodes and their connections, without specifically denoting which are left children and which are right children. In a more complete implementation, you might want to include such details, or others specific to your use case.
Before using the above code, make sure to install required libraries (if they’re not installed already) using pip:
pip install matplotlib
pip install networkx
Display a Binary Search Tree Manually in Microsoft Visio or Lucidchart
Both Microsoft Visio and Lucidchart are powerful tools for creating a wide variety of diagrams, including binary search trees. Here’s a simple step-by-step guide to creating a binary search tree in both.
- Open Microsoft Visio
- Click on “New” and choose “Basic Diagram”.
- Click on the “Shapes” window and select “More Shapes”.
- From the dropdown menu, select “General” and then “Basic Shapes (US units)”.
- Drag and drop rectangles onto the canvas to represent each node in the tree.
- Type the value of each node into the corresponding rectangle.
- To create the edges (connections) between the nodes, use the “Connector” tool in the “Home” tab under the “Tools” group. Connect each parent node to its child nodes by dragging from one rectangle to another.
- Repeat the process until you have created the entire tree.
- Open Lucidchart.
- Click on “+Document” to create a new document.
- From the shape library on the left, select the shapes you want to use to represent your nodes and edges. “Rectangle” for nodes and “Line” for edges would be common choices.
- Drag and drop the shapes onto the canvas and arrange them to represent your binary search tree.
- To add values to the nodes, select a node and start typing.
- Use the line shape or the connection lines to connect the nodes appropriately.
- Repeat the process until you’ve completed the entire tree.
Note: The exact details might vary slightly depending on the version of the software you’re using. Always refer to the official documentation for the most accurate information.
Conclusion
In conclusion, visualizing a binary search tree (BST) is a powerful tool that can help programmers better understand the structure and properties of this vital data structure. Visualization can be particularly beneficial when learning about BSTs for the first time, debugging a tree-based algorithm, or explaining these concepts to others.
Python libraries such as Matplotlib and NetworkX provide the capability to create graphical representations of binary search trees. However, a text-based representation can also be an effective way to understand and visualize a BST, particularly in an environment where graphical tools may not be available.
While these visualizations can provide valuable insights into the structure and relationships within a binary search tree, they do not replace a deep understanding of the underlying principles, including how nodes are inserted, searched, and removed. Understanding these operations is critical for effectively using binary search trees in real-world applications.
Remember that the efficiency of BSTs is highly dependent on the balance of the tree, and visualization can help identify cases where the tree becomes imbalanced. In such scenarios, self-balancing binary search trees, such as AVL trees or Red-Black trees, could be more efficient.
