
In this article, we demonstrate how to train a machine to identify buying zones for Bitcoin offering good return on investment. We chose 2 metrics to assess how undervalued Bitcoin is and used them to spot good entry points.
1. First, we defined the term “performant buy”
We assumed a simple rule: if the Bitcoin price rose by more than 50% in 4 months after the buy, it was a “performant buy“.
An illustration with 2 different buying dates:

The left case is not performant, as buying at that date does not generate a 50% return after 4 months. The right case is performant, as buying at that date leads to more than 50% return in 4 months.
2. Then, we defined 2 dimensions for the analysis
We considered 2 dimensions for plotting all of the Bitcoin prices on a 2D chart:
– The Bitcoin Dominance A simple ratio representing the weight of Bitcoin with respect to the entire cryptocurrency space:

If the Bitcoin Dominance is high, people are heavily invested in Bitcoin over altcoins. If the Bitcoin Dominance is low, people are more invested in altcoins over Bitcoin.
You can access the Bitcoin Dominance chart here. – The Stock-To-Flow Deflection Stock-To-Flow (S2F) is a model developed by PlanB predicting the price of Bitcoin based on supply-demand. The Stock-To-Flow Deflection is a simple ratio evaluating how far the current price is from that prediction:
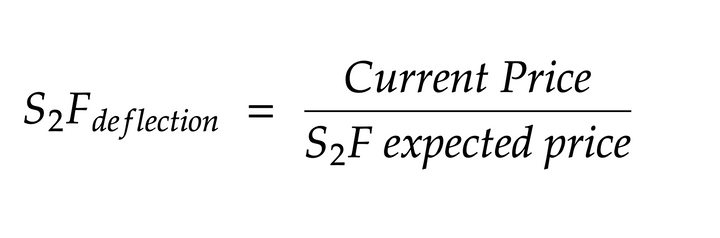
If the deflection is ≥ 1, it means that Bitcoin is overvalued according to the Stock-To-Flow model. If the deflection is <1, the asset is undervalued according to this model.
You can access the S2F deflection chart here after creating an account for free.
3. We plotted 7 years of Bitcoin price history against these dimensions
The historical price of Bitcoin over the past 7 years was plotted with respect to the 2 dimensions we’ve defined:

Then we labelled our points based on our “performant buy” label:

As expected, the best returns are when the stock-2-flow deflection is low (<1): that’s where the blue points are.
But could we be more accurate regarding the Bitcoin buying zones?
4. Eventually, we applied a “k-nearest neighbors” to generate a map
We zoomed in on a realistic area for both dominance and deflection:

On this sub-domain, we can create an artificial mesh with each point of the mesh taking the colour of its (k) closest “neighbors”. This is a famous supervised algorithm that checks the colour of surrounding points (k of them) to deduce the colour of a new one. A simple illustration:

Looking at the 3 items surrounding the mystery item, the algorithm detects that it should become a blue square, as 1 red triangle is outnumbered by 2 blue squares. Applying this algorithm, we injected a million-point mesh into our initial scatterplot and ran the simulation for k=5 and k=10, giving us the following maps with the performing buy zone in blue and non-performing buy zone in red:

Here, we identified 2 buying zones:

Buying Zone 1: when the Bitcoin Dominance is low (below 57%) and S2F-deflection is below 1. This corresponds to the “Bitcoin is dead, other faster and cheaper altcoins will take over” undervaluation narrative; a classic joke during an altcoin season. The altcoin bull market drags Bitcoin dominance to low levels. It’s a good moment to buy Bitcoin, as the king never sleeps for long against the other coins.
Buying Zone 2: when the Bitcoin Dominance is high (above 67%) and S2F-deflection is below 1. This corresponds to the “crypto assets are a scam and will die because of regulation” undervaluation narrative; a classic during a crypto bear market. It’s a good moment to buy Bitcoin, as it tends to maintain its domination momentum when the entire asset class is under attack (anti-fragility) and bounces back higher.
5. Conclusion and Perspectives
We’ve presented a very simple supervised learning bi-dimensional model like we did a long time ago for stocks. It shows that the best way to optimise returns in 4 months is to buy undervalued (s2f deflection under 1) and when the Bitcoin Dominance is at extreme values (Bitcoin Dominance under 57% or above 67%). These 2 buying zones correspond to a negative media narrative about Bitcoin versus altcoins (buying zone 1) or to an attack towards the entire asset class (buying zone 2). This study can be challenged in a myriad of ways: the calculation of performance, the choice of dimensions, the level of model convergence, the fact that the data is based on past cycles, or that the return of altcoins is not considered. However, some interesting patterns seem to have emerged and we hope it has given you some good insights. To finish, an inspiring quote from the father of modern statistics, to remember that models are only hints:
“All models are wrong, but some are useful” George Box
Take care,
Clem
