
The point of this article is to begin a tour of machine learning predictive models for crypto assets. Today, we start gentle with a linear regression for crypto (level 0 of machine learning) to estimate the fair value of Bitcoin based on the hash rate. What is the hash rate? what is a linear regression? How to use them to spot buying and selling zones? Too many questions. Let’s dive in but keep in mind that this is NOT financial advice, all we’re doing is playing with computers.
1. What Is The Bitcoin Hash Rate?
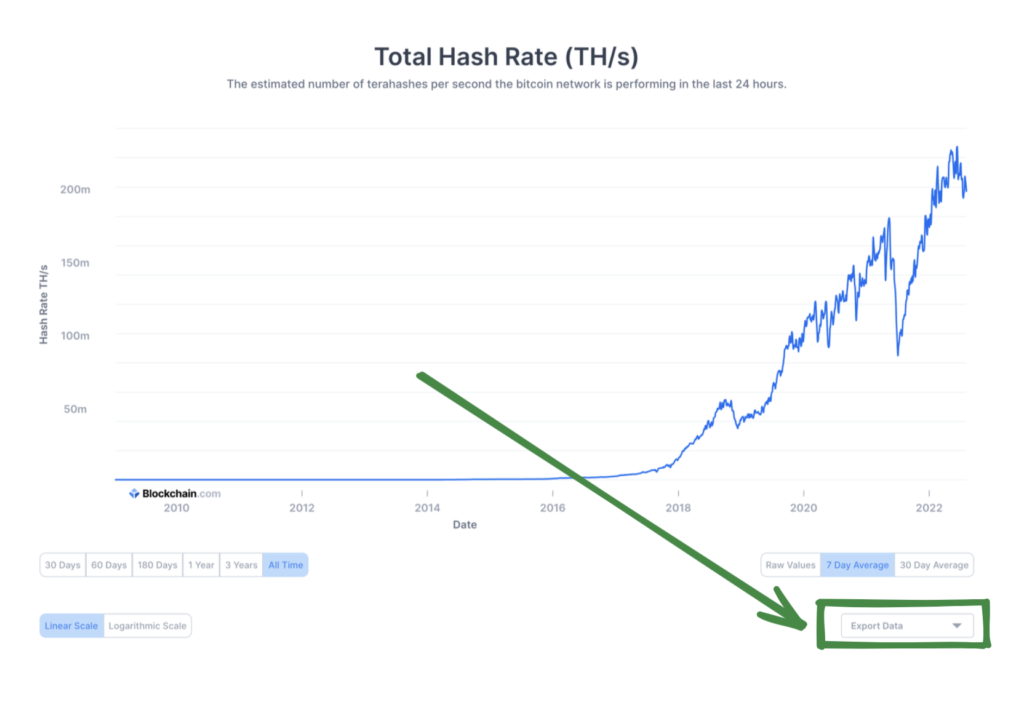
The BTC hashrate is a measure of the total amount of energy used to mine Bitcoin. If the hashrate is high, it means that miners are mining a lot and that the network is very secure. If the hashrate is low, it means that miners are mining less than usual and that the network is less secure.
The hashrate of Bitcoin has been raising constantly over time, as more and more miners are securing the network:

Why is it called “hash” rate? A hash is this unitary operation machines need to do to validate Bitcoin transactions. In fact, the hash rate indicates the number of times hash values are calculated for PoW blockchains every second.
Now, the 1 million dollar question: how does the market capitalization of Bitcoin move with respect to the hash rate?
2. Get the Bitcoin Hash Rate and the Bitcoin Market Cap Data
To get the hash rate data, I went on blockchain.com and it did the job with the “export data” feature at the bottom:
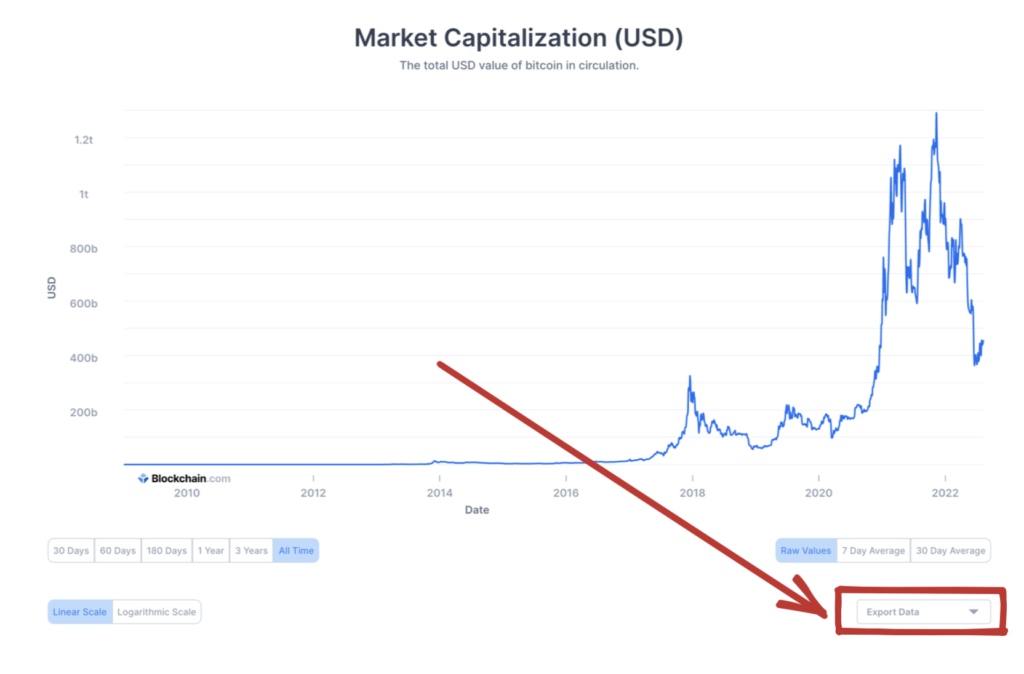
The same can be done for the market cap, “export data” at the bottom here:
It will give you 2 CSVs that you can load with Pandas, a Python library for data science:
import pandas as pd

hashrate = pd.read_csv('hashrate.csv')
marketcap = pd.read_csv('marketcap.csv')
3. Linear Regression For The (Hash Rate, Market Cap) Distribution
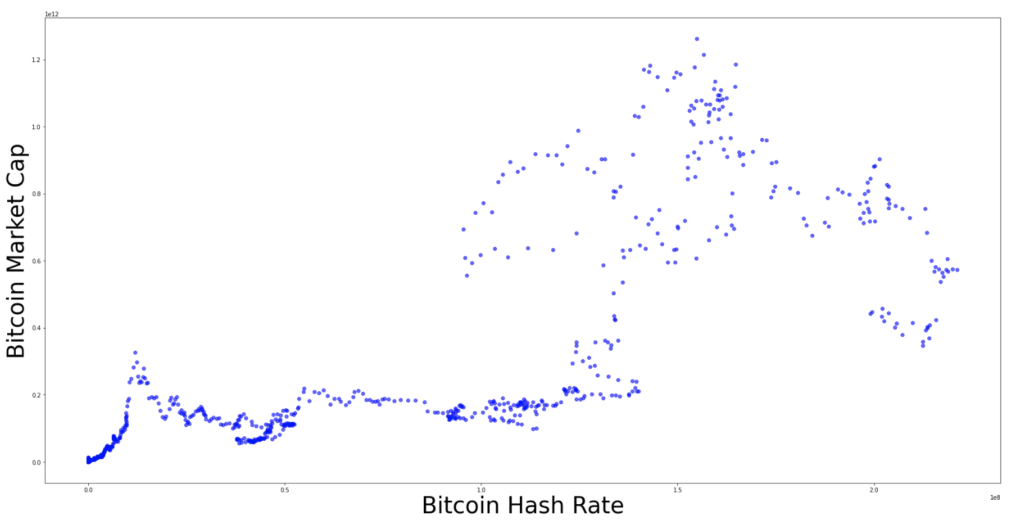
Now that we have the data, let’s plot the Bitcoin market cap with respect to the Bitcoin hash rate:
We can apply a linear regression to find a “fair value”, the red line below:
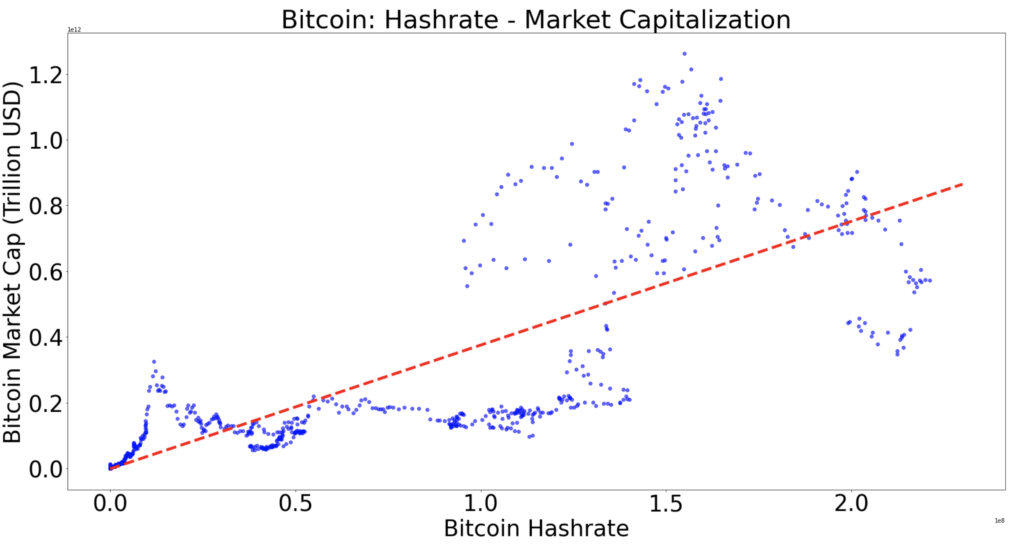
In fact, the interpolation has been done using the Python Numpy library and its Polyfit module:
linear_regression = numpy.polyfit(dataframe["hash-rate"], dataframe["Marketcap"], 1)How did the library get this red line? First, let’s call the function behind the red line “f”.
Then f is linear and can be written as:
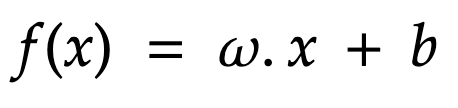
How to find b and omega to define precisely what f is?
Well, we use the Mean Squared Error (MSE), also called loss function:
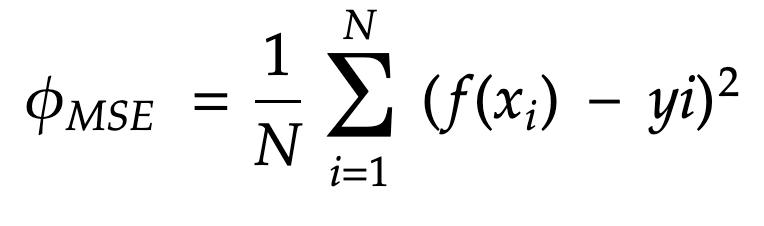
This equation defines the average distance between the blue points and the red line (representation of the “f” function) to be found.
Well we want to minimise that my friends, so the red line is “as close as possible” from the blue points:
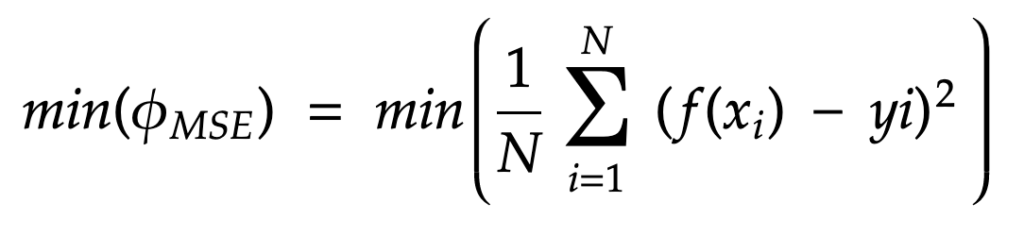
In fact, one can solve that equation (and find w,b and finally f) using a myriad of methods. We can calculate w and b directly by taking the derivative of the MSE equal to 0 (solving this gives an extremum, which we want to find the minimum) or using iterative methods like the gradient descent, more algorithm-friendly. I’ve been overthinking if yes or no I would go through those in this article and final answer is … No. It would be too heavy. Another one will come specifically on how algorithms and humans usually solve the MSE minimisation problem.
If the minimization process gives you the function f (red line), it also gives you the minimum itself. This minimum is called “R squared” and gives a good idea of the fit:
– if R^2 is under 1, the linear regression is a “good” model
– If R^2 is above 1, using a linear regression is probably not a good idea.
Here, I calculate “R squared”:
rsq1 = numpy.corrcoef(dataframe["hash-rate"], dataframe["Marketcap"]);
r_squared = rsq1[0][1]**2
Eventually, it gives the following value for the error:
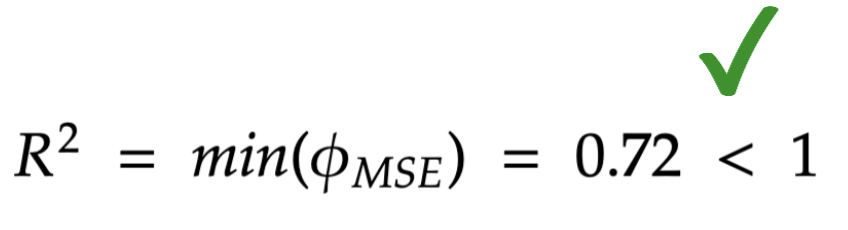
R squared is below 1: happy days. The linear regression is a reasonable choice to model the (Hash Rate, Bitcoin Market Cap) distribution.
3. Regression Rainbow: Buy Zones And Sell Zones
Let’s assume that the red line, expression of “f”, is the fair value for Bitcoin. Then being under it is “undervalued” and being above it is “overvalued”.
Now, I’ve decided to slice the part above the line with 3 multipliers of the standard deviation and the part bellow it with 3 other multipliers of the standard deviation. The standard deviation is the average distance of the points to the regression.
It gives the following rainbow:
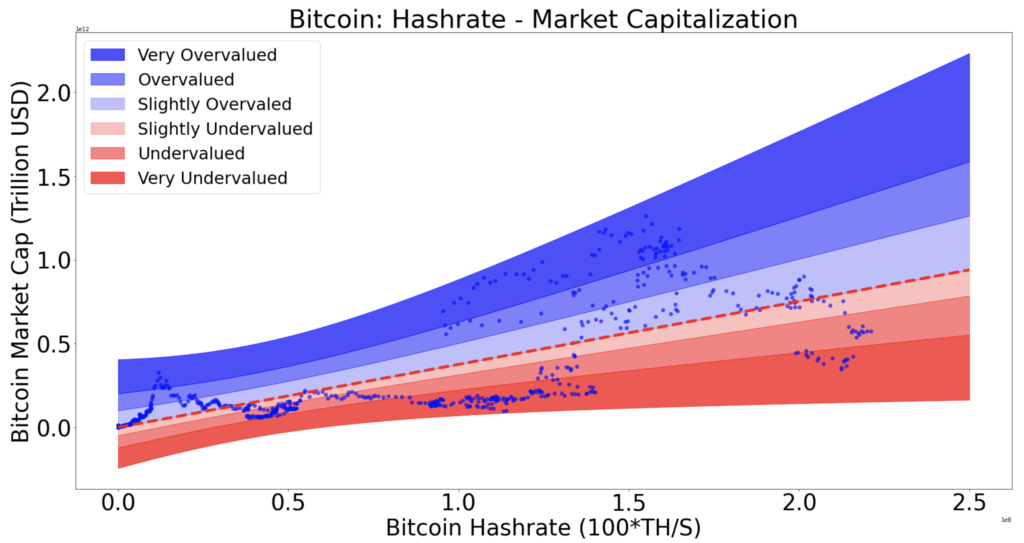
I keep the exact recipe for myself for now, there is a lot to say about how the slicing has been decided and it would be good for another article. Question: where are we today?
Answer sir:
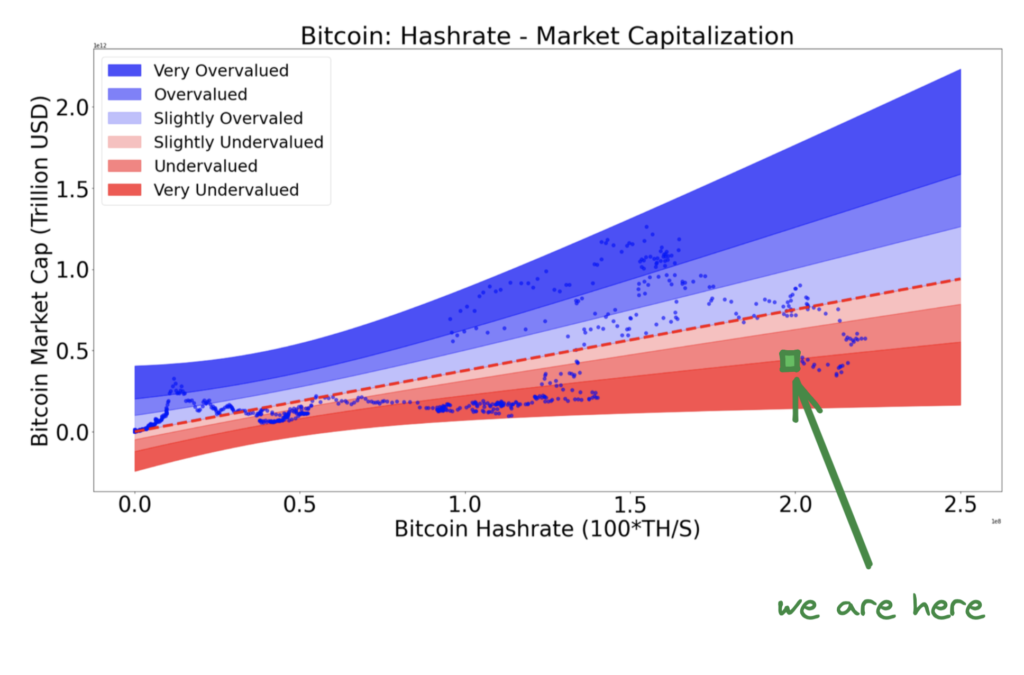
In fact, it’s interesting to see that this model, like most of the others, is spotting an undervaluation of Bitcoin. However, there is room for more downside as it’s not yet in the lower band.
4. Conclusion
To conclude, this “linear regression for crypto” (proof-of-work only) model has no pretension but it shows a clear undervaluation for Bitcoin. This work is a way to start talking machine learning and show what is possible to do beginning with the simplest models, just like I did in this Bitcoin interpolation map model last year. However, I will keep track of it on Twitter to signal change of zones but also keep moving to more advanced models: clustering, recommendation engines, learning trees, gradient boosting and hopefully way more. Finally, the last point I wanted to make is that a linear regression for crypto assets might be relevant or irrelevant depending on the dimensions you choose. In the case we looked at, it makes kind of sense but if you use time as a dimension, you’re after an exponential trend and our tool doesn’t really fit anymore.
Thanks for reading.
n.b: this is not financial advice
