
Bitcoin not getting any younger and a myriad of investment indicators have been spawning over the years. From the Pi Cycle top to the RHODL ratio or to more historic ones like the RSI: they all tell you part of the truth. In this article, I will talk about a relatively new indicator: the CBBI. It’s an indicator composed of other indicators with various weights. The goal is to capture a bit of each model and give a multi-angle view on the Bitcoin price. I always thought that a model, one day, would come up with some sort of a combination of what is currently used by most people.
In practice, analysts focus on one, usually the one that they have invented and forget to include others. It’s a common bias. However, I was delighted to find the CBBI. It’s an indicator embracing the brains of different analysts to give a valuation overview.
1. What is the CBBI indicator?
Secure your crypto assets forever
The CBBI indicator is a mix of 10 indicators that is used by investors to spot the Bitcoin price top and the Bitcoin price bottom:
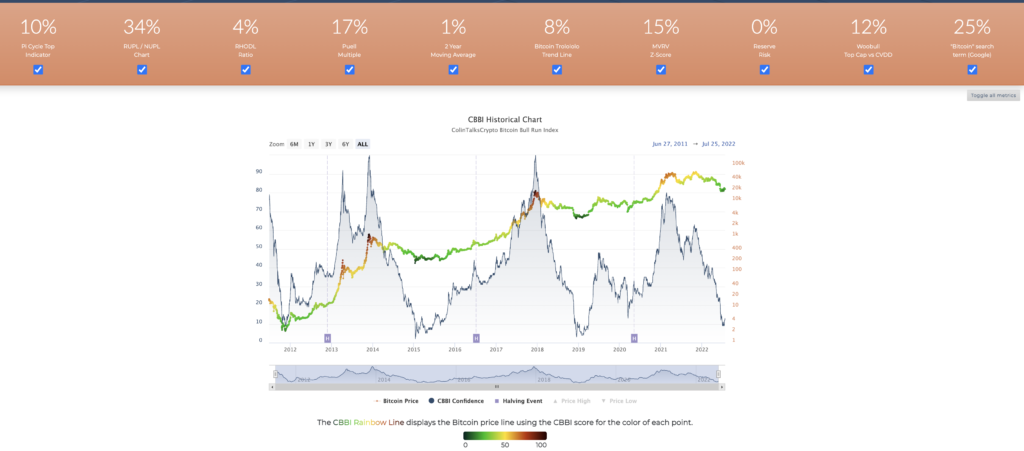
If you look at the orange band at the top, it gives you the weight for each indicator that the formula takes into account. Some of them are more weighted (considered as more important) while some others are less weighted (considered as less important). These weights are moving, constantly refitted in realtime to be as good as they can: that’s really the strength of the model.
As you can see it does a pretty good job at calling both top (red) and bottom (blue):
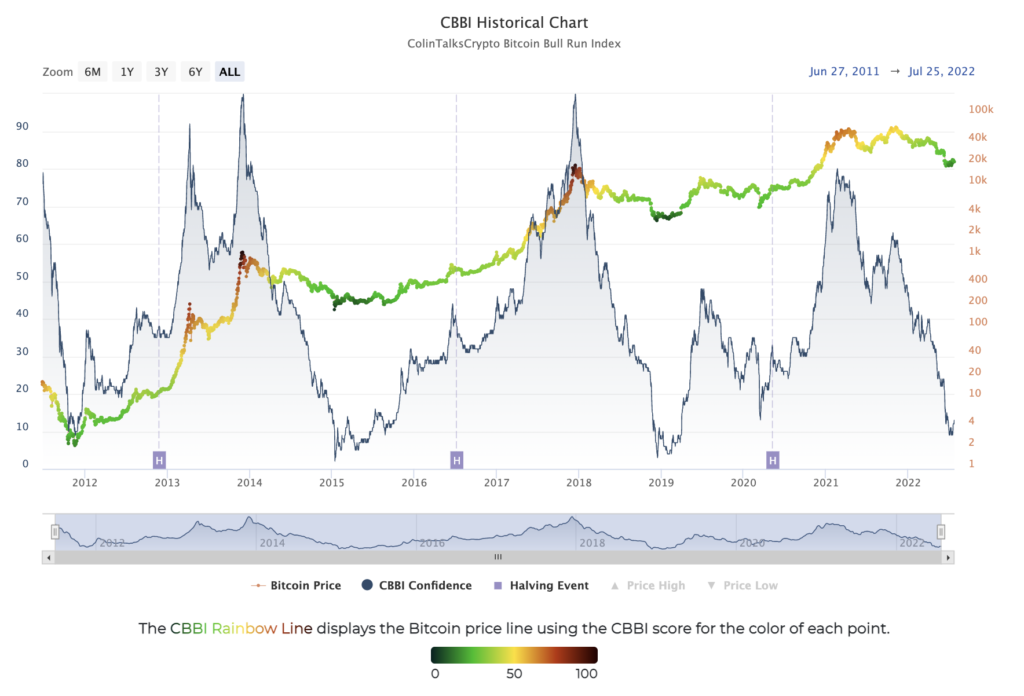
On the chart above, the blue line is the price of Bitcoin and the coloured line is the indicator. The colour is based on the value of the indicator from 0 to 100. It has been back tested on the Bitcoin prices from 2010 to today and shows a good capacity at integrating oversold and overbought regions. You might wonder what to do with it now? It can look a bit unclear at first but you can define pretty straightforward rules to guide you to invest.
2. How to interpret it?
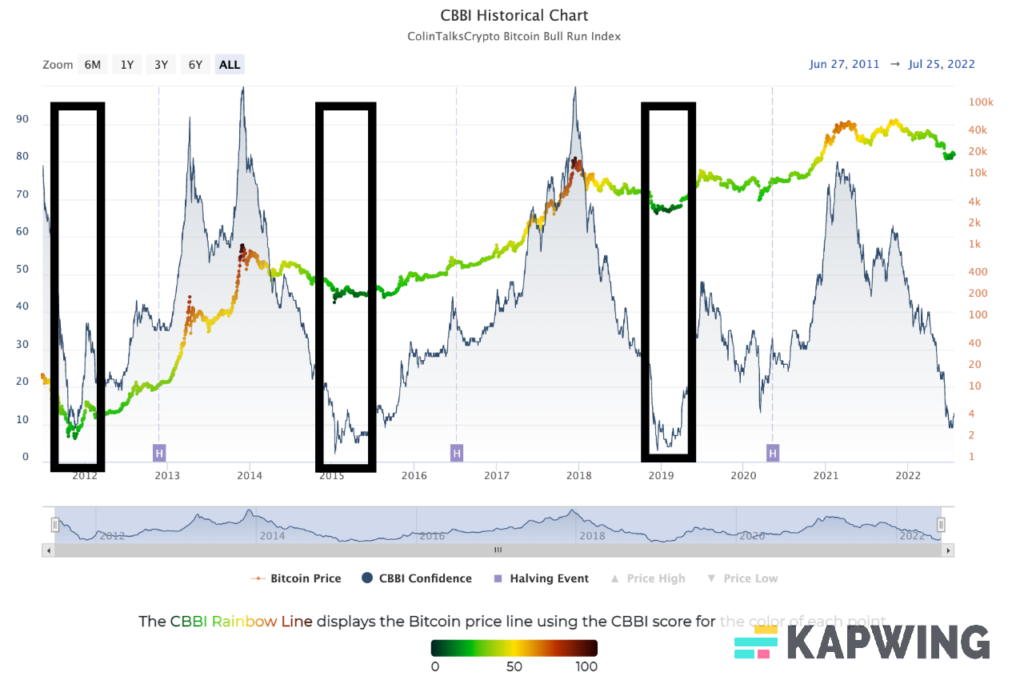
Historically, when the indicator is between 0 and 10, it’s a bottom. Time to buy:
Alternatively, when the indicator is between 70 and 100, it’s a top. Time to sell:
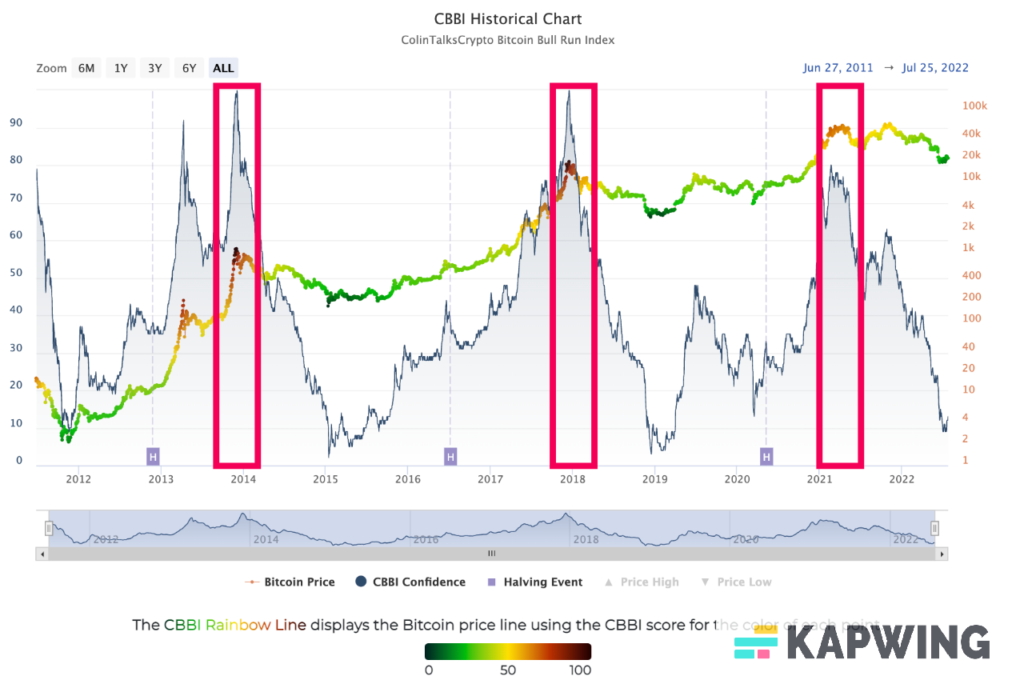
As you can see, the performance of the indicator is really good and seems to scream at you “BUY” or “SELL”. It’s interesting to think about the current value, we’re slightly above 10. Is it a buy? Or not yet? In my view, it’s a good moment to start to DCA just because the bottom might already be in (and the model is not perfectly fitted) or it will come and last a day and you will miss the perfect entry point. Obviously this is not investment advice but I am aggressively buying (and I do whatever I want :D!).
3. What is the composition of the CBBI Indicator?
The CBBI indicator is a mix of all the historical indicators to predict the bitcoin price including on chain indicators and statistical indicators. More precisely, the CBBI is a weighted combination of:
-The Pi Cycle Top indicator: The Pi Cycle Top Indicator has historically been effective in picking out the timing of market cycle highs to within 3 days. It uses the 111 day moving average (111DMA) and a newly created multiple of the 350 day moving average, the 350DMA x 2.
–The Net Unrealized Profit/Loss: Unrealized Profit/Loss estimates the total paper profits/losses in Bitcoin held by investors This is interesting to know but of greater value is identifying how this changes relatively over time.
–The ROHDL ratio: HODL waves are different age bands of UTXO’s (coins) weighted by the Realized Value of coins within each band.
–The Puell multiple: This metric looks at the supply side of Bitcoin’s economy – bitcoin miners and their revenue. It explores market cycles from a mining revenue perspective.
–The 2-year moving average: the moving average is the price average on the last 2 years.
–The Trololo trend-line: it is a logarithmic regression fit based on all past data points of the Bitcoin price.
–The MRV Z-Score: it is a bitcoin indicator using on-chain analysis to identify periods where Bitcoin is over or undervalued.
–The Reserve Risk: a bitcoin metric that allows us to visualise the confidence amongst long term bitcoin holders relative to the price of Bitcoin at a given moment in time.
–Top Cap: Proposed by Woo in collaboration with Puell, “top cap” aims to achieve the opposite of the delta cap, in that is has been experimentally configured to pinpoint the tops of bitcoin’s explosive bull markets.
4. The CBBI challenges
The CBBI indicator has been able to spot bottoms and tops so far but will it still manage to do it in the future?
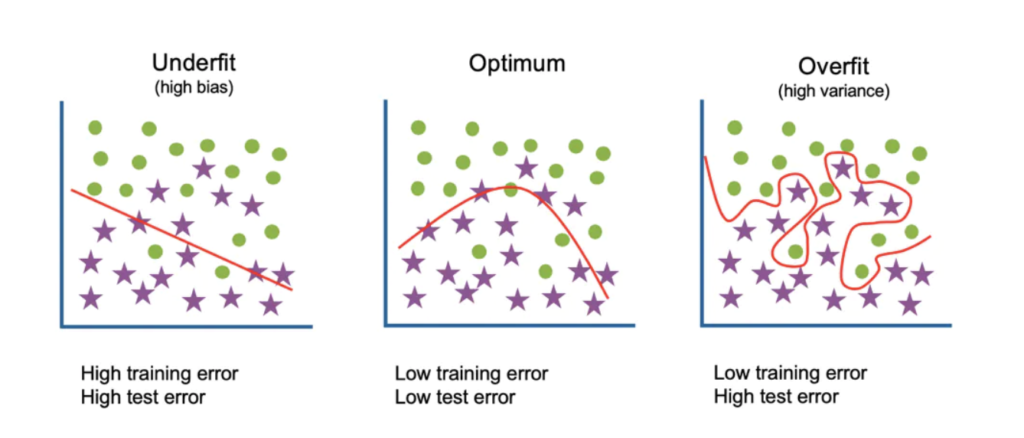
Isn’t it “overfitting”? “Overfitting” is when a model is very very good at predicting that past (“training set”) but does not generalize well:
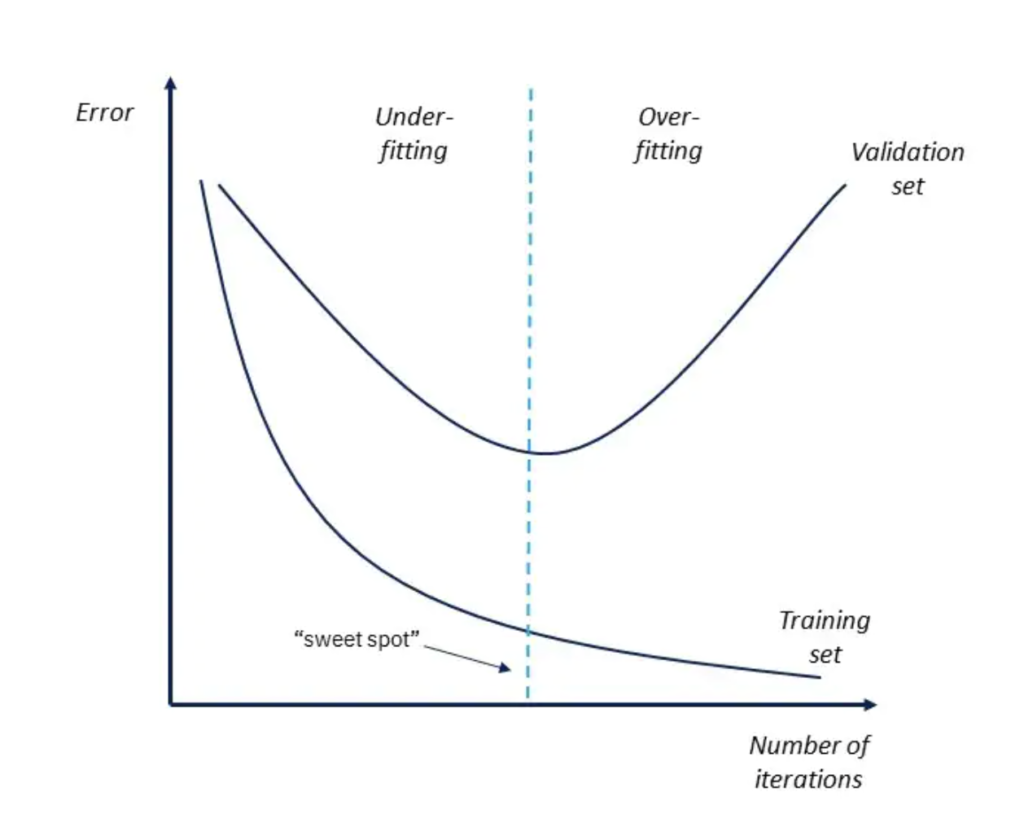
In fact, what you’re after with such models is a “sweet spot”, an optimum between overfitting and underfitting:
What I like with the CBBI is that it comes with weights (coefficients multiplying each core indicators that you can tune) to give more or less importance to one of the indicators versus the others for example. It is a great machine learning experiment that I will be running in the future, while also considering other features. And why not define an AOI (Altcoin Oracle Indicator) 😉 ?
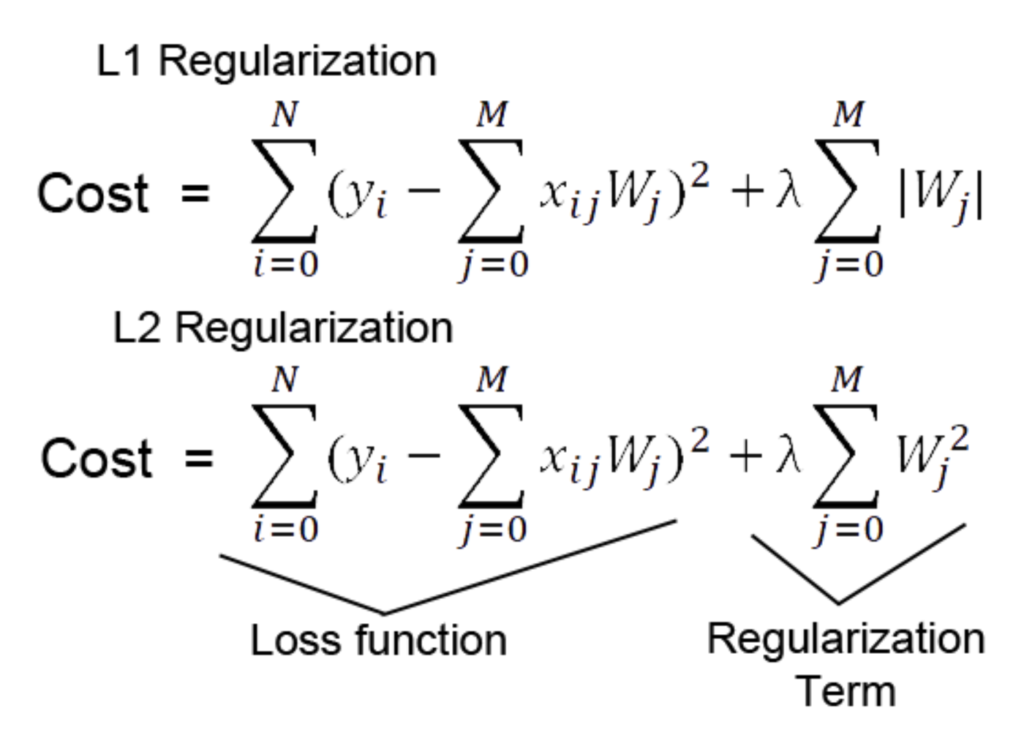
There are indeed, multiple things that could be done to improve the model’s ability to predict the future. It could be adding or removing features but also adding a regularisation term to the formula to prevent overfitting.
Among the tools that could be used to improve the model: the L1-regularization and L2-regularization, both adding a penalty term (order 1 or order 2) with a coefficient (lambda) to tune to avoid overfitting.
All of this will be explored in a future machine learning article on trading indicators. I’m planning to do a feature selection and then tune some weights differently to come up with an alternative regularized model.
4. Conclusion
I like the CBBI indicator because it includes many powerful metrics. To be predictive with Bitcoin, it’s really important to capture its different aspects (e.g: on-chain, statistical). I like to consider logics that embrace them all. The CBBI indicator has been able to spot bottoms and tops so far and refits its weights in realtime but isn’t it “overfitting”? Maybe. However it is still a very interesting approach that I want to explore: how does it fit the weights? Couldn’t it be done in a more efficient way?
One last thing I would like to say about all these indicators is that “all models are wrong, some are useful”. You will not find the ultimate model predicting all the bottoms and all the tops. They can only guide you towards a better understanding of the crypto market. In fact, these models are simply here to inspire you when you’re about to take a decision. When one of them is green, not enough. But what if 25 of them coming from 3 different domains of mathematics are screaming “BUY”?
Thanks for reading.
n.b: this is not financial advice
