
The Relative Strength Index (RSI) is a technical indicator to spot oversold and overbought assets. I always keep an eye on it to invest in crypto because it gives me a sense of overvaluation and undervaluation regardless of my feelings. It’s a good way to evaluate how weak a price signal is to invest in the underlying asset. It also tells you when it’s getting overly strong with respect to its trend and should encourage you to sell. For me, it’s in the same family as the logarithmic regression bands: it’s a helper to cut the noise and focus on the distance to the trend line.
1. What is the RSI?
The RSI has been developed in 1978 as a momentum oscillator for price. Traders use it to quantify the price momentum of stocks, bonds, commodities or crypto assets. The idea is that it evaluates how quickly traders are bidding an asset up or down. The RSI plots this result on a scale of 0 to 100 and is defined as follows:
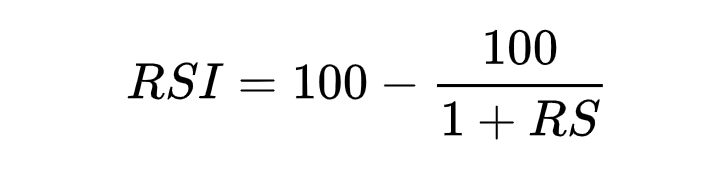
RS is the relative strength factor and is defined as the ratio of the upper smoothed average on the lower smoothed average:
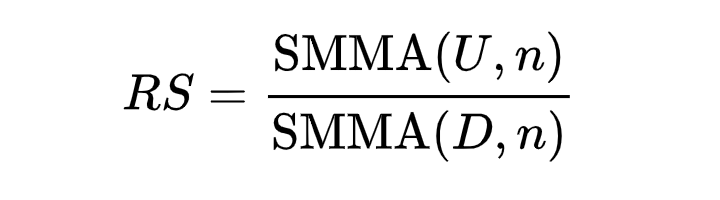
SSMA(U, n) is an approximation of the upward change. SSMA(D, n) is an approximation of the downward change. It gives a ratio between the two to quantify if the momentum is upward or downward on a given period n. That value is then transformed to percentage to give the actual RSI. In short, it’s some sort of a percentage of upward or downward momentum on a period of reference.
2. How to interpret it?
Traders usually use this indicator to spot overbought and oversold zones:
When the RSI is over 70, the asset is usually considered “overbought”.
When the RSI is below 30, the asset is usually considered “oversold”.
3. The RSI for Bitcoin and other assets
An easy way to know if Bitcoin is undervalued or overvalued is to look at the its RSI on this page:
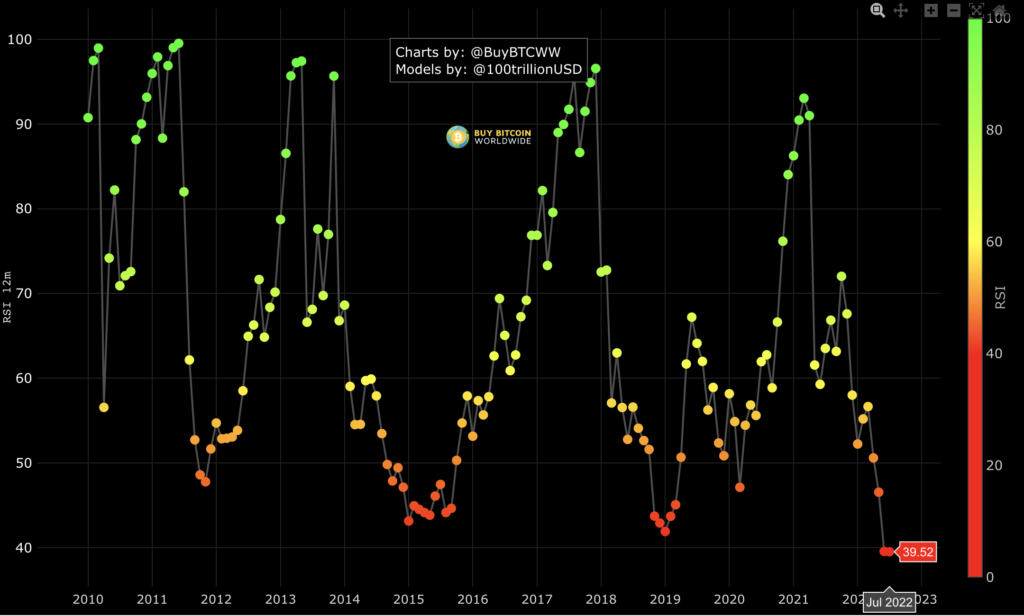
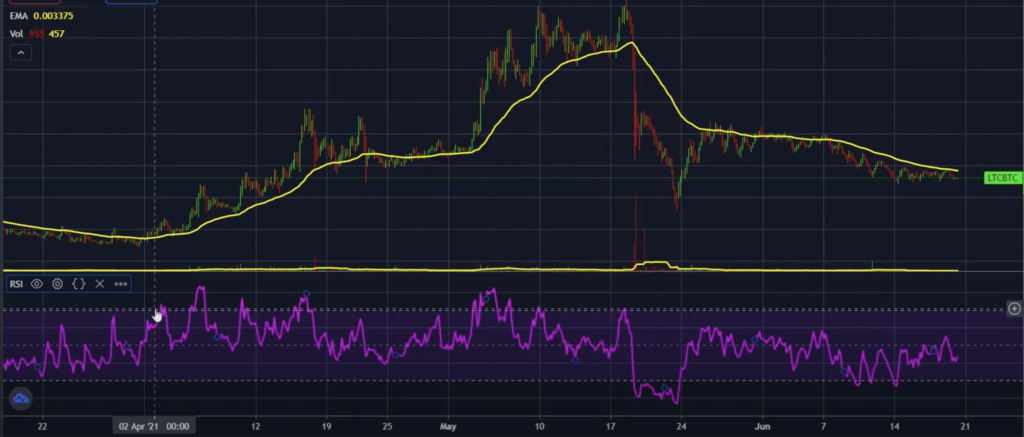
Following that chart like the bible would have made you very rich buying under 30 and selling over 70. As you can see, the RSI is very strongly cyclical with clear overbought and oversold patterns.
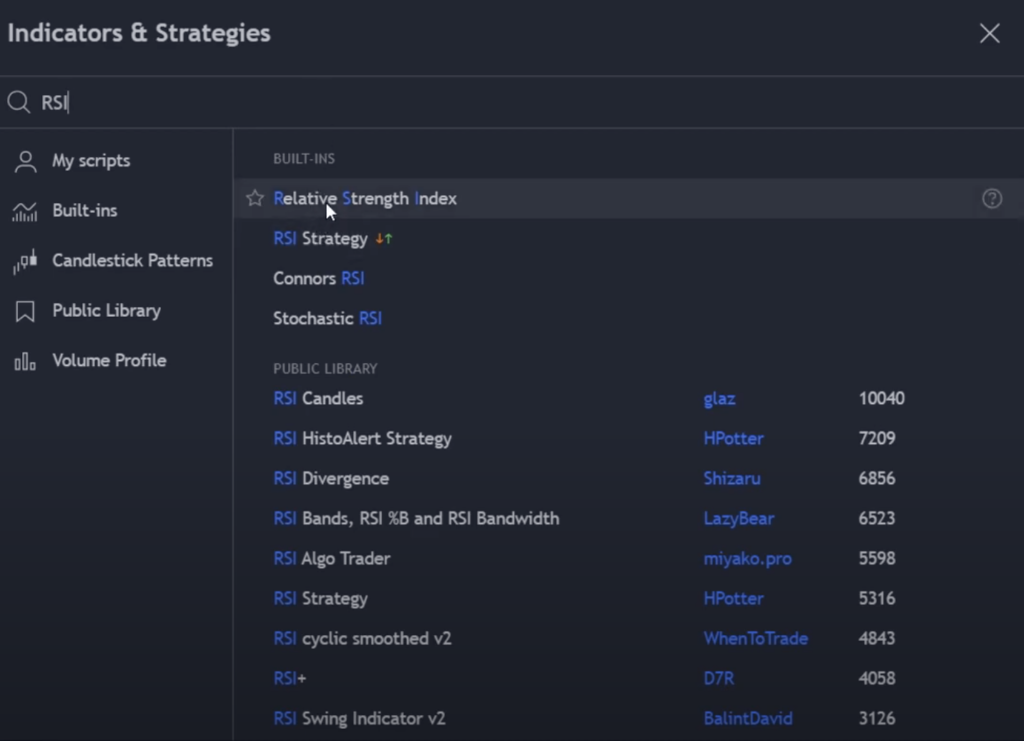
If you’re interested in setting it up yourself for different assets, the best is to use tradingview:
In tradingview, there is an “indicator and strategies” menu where you can find the RSI:
It will then appear at the bottom of your price chart:
4. The limitations of the RSI
The RSI is a purely technical indicator and has its limits. Today, prices are regularly in exponential modes leading to significant periods of overvaluation and undervaluation with no respect for the technical indicators. Yes, it does refer to how abnormal a signal is in an overly bullish run. However, nowadays bull runs tend to persist longer because of all the weirdness of the macro economy.
In my view, the RSI is a great reminder of where we are with a “statistical system” view. It gives you an idea of where you stand and, in some ways, it’s an evaluation of the risk you take at a given moment in time.
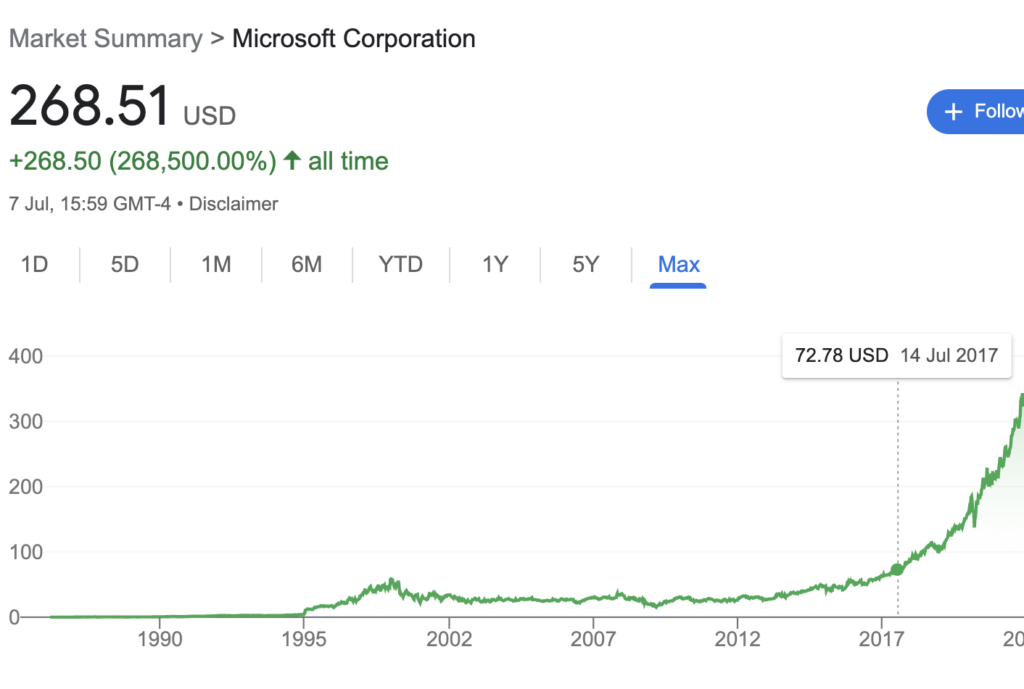
But you need to remember that superior assets can look like that for a very very long time:
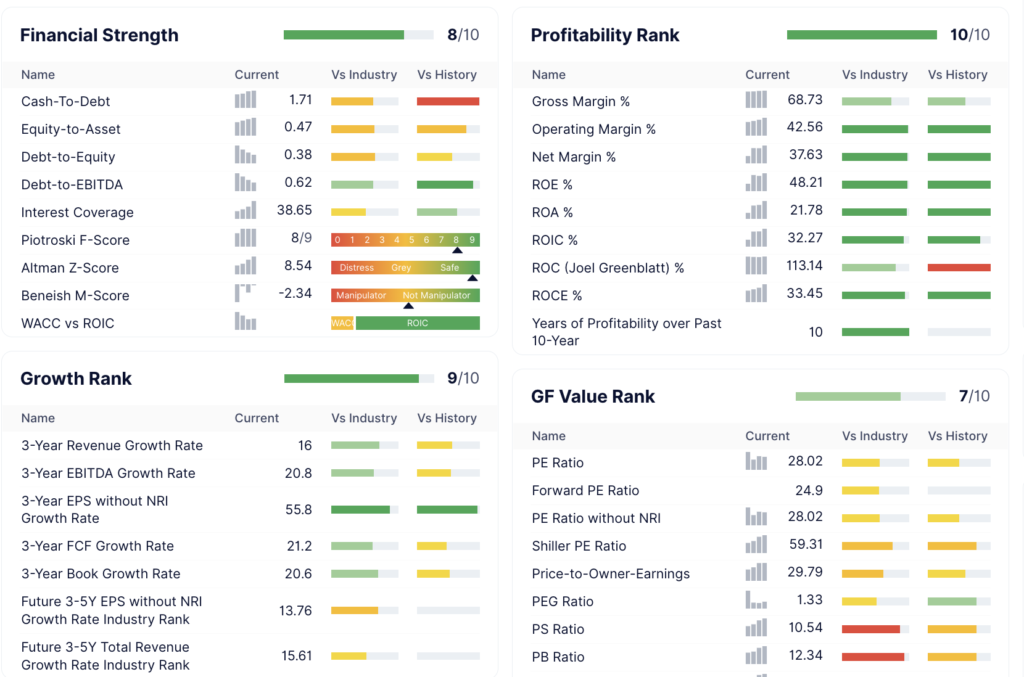
And as a consequence I also always keep an eye on the fundamentals to balance what the RSI is saying:
5. Conclusion
The RSI is a great technical tool to spot price anomalies and guide you from a signal point of view. However, it’s good to remember that you’re buying assets because of the fundamentals in the long term. So you want a mix of both: buying a weakened price signal of an asset with outstanding fundamentals.
Homework time!
What do you think is the current RSI of my best crypto friend:
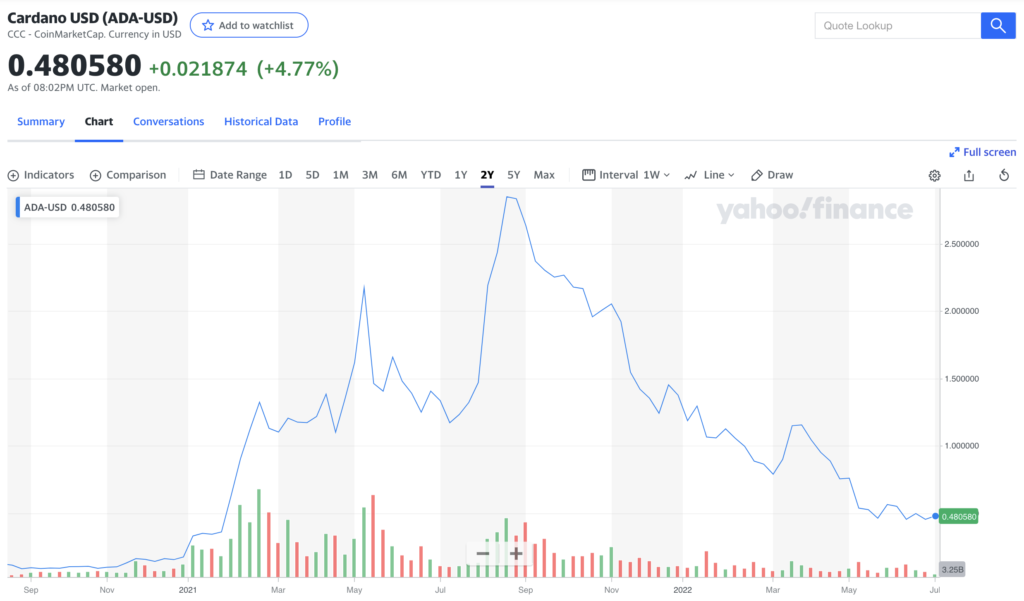
You have until the Vasily hard fork release to answer and decide what to do with your funds.
Tick tock. Tick tock.
Thanks for reading.
n.b: this is not financial advice
