
In the Modern Portfolio Theory (MPT), volatility is risk. That’s why, in this article, we have a look at volatility computations for crypto portfolios in Python.
If you want to control your risk as a trader, you need to up your game in terms of understanding of volatility.
Volatility can be calculated in different ways… but in this article we will do it using standard deviation on historical data.
We define various portfolios of crypto assets and compute their standard deviation across a year: the annualized volatility.
Based on the results, what is the less risky crypto portfolio?
1. What Is The Annualized Volatility?
The annualized volatility of a portfolio is the volatility over a given year. The general volatility formula for any period and time horizons is:
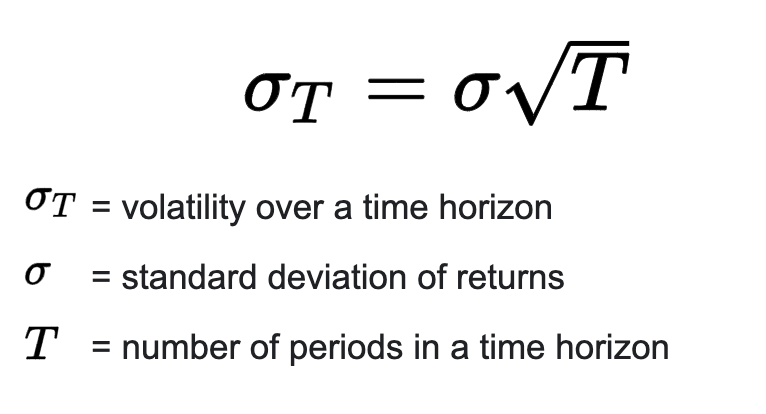
In the formula above: T is equal to 365, the number of trading days in a year as crypto markets are trading every day.
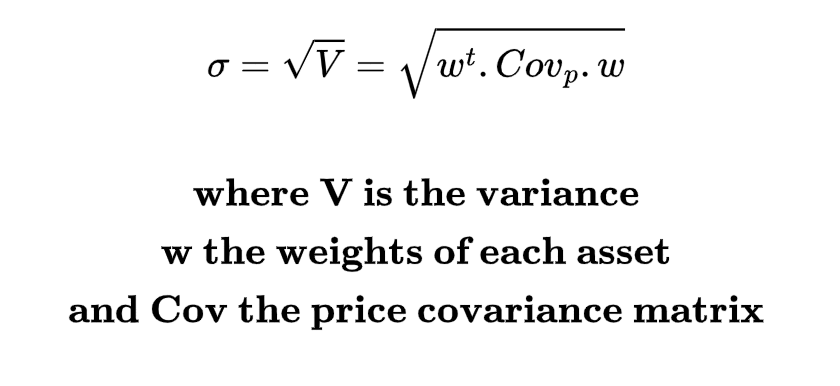
Now, how to get the standard deviation of returns of a portfolio based on the weight of each asset?
Using the price covariance and the weight vector (weight for each asset) in the portfolio:
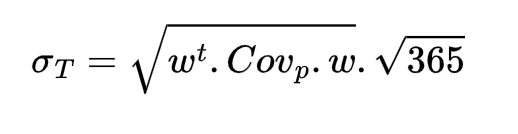
So the annualized volatility (T=365 days) is:
2. Get The Price Data
Let’s imagine you have a balanced portfolio Bitcoin, Cardano, Polkadot, Ethereum:
w = [0.25, 0.25, 0.25, 0.25]We get the prices daily over a period of one year
You can download them from yahoo finance and load them with a simple snippet:
import pandas as pd

files = ["BTC-USD.csv", "ADA-USD.csv", "DOT-USD.csv", "ETH-USD.csv"]
dfs = []

for file in files:
   df = pd.read_csv(file).drop(columns=["Open", "High", "Low", "Adj Close", "Volume"])
   df["Close"] = df["Close"].astype(float)
   df = df.rename(columns={"Close": file.split("-")[0]})
   dfs.append(df)

dfs = reduce(lambda df1,df2: pd.merge(df1,df2, on='Date'), dfs)
It gives you the prices by date in a dataframe:
           Date           BTC       ADA        DOT          ETH
0    2021-12-17  46202.144531  1.219892  24.663027  3879.486572
1    2021-12-18  46848.777344  1.242534  25.490757  3960.860107
2    2021-12-19  46707.015625  1.244661  24.791401  3922.592529
3    2021-12-20  46880.277344  1.238240  24.050674  3933.844482
4    2021-12-21  48936.613281  1.280859  25.194195  4020.260010
..          ...           ...       ...        ...          ...
361  2022-12-13  17781.318359  0.312865   5.276955  1320.549194
362  2022-12-14  17815.650391  0.308134   5.215210  1309.328735
363  2022-12-15  17364.865234  0.300201   5.226642  1266.353882
364  2022-12-16  16647.484375  0.264070   4.655857  1168.259399
365  2022-12-17  16708.097656  0.263521   4.672759  1178.416260
3. Compute The Annualized Volatility
To calculate the annualised volatility, we simply apply the formula defined in (1) to the dataframe of prices defined in (2):
import numpy as np

weights = [0.25, 0.25, 0.25, 0.25]

portfolio_returns = dfs.pct_change()

covariance = returns.cov()

portfolio_variance = np.transpose(self.weights) @ covariance @ self.weights

annualized_volatility = np.sqrt(portfolio_variance) * sqrt(365)
You’ll get the following annualized volatility: 0.781
Now, let’s create 4 different portfolios with different weights on BTC, ADA, DOT and ETH:
weights_portfolio_1 = [0.25, 0.25, 0.25, 0.25]
weights_portfolio_2 = [0.4, 0.2, 0.2, 0.2]
weights_portfolio_3 = [0.6, 0.1, 0.1, 0.2]
weights_portfolio_4 = [0.8, 0.05, 0.05, 0.1]
They give the following volatilities:
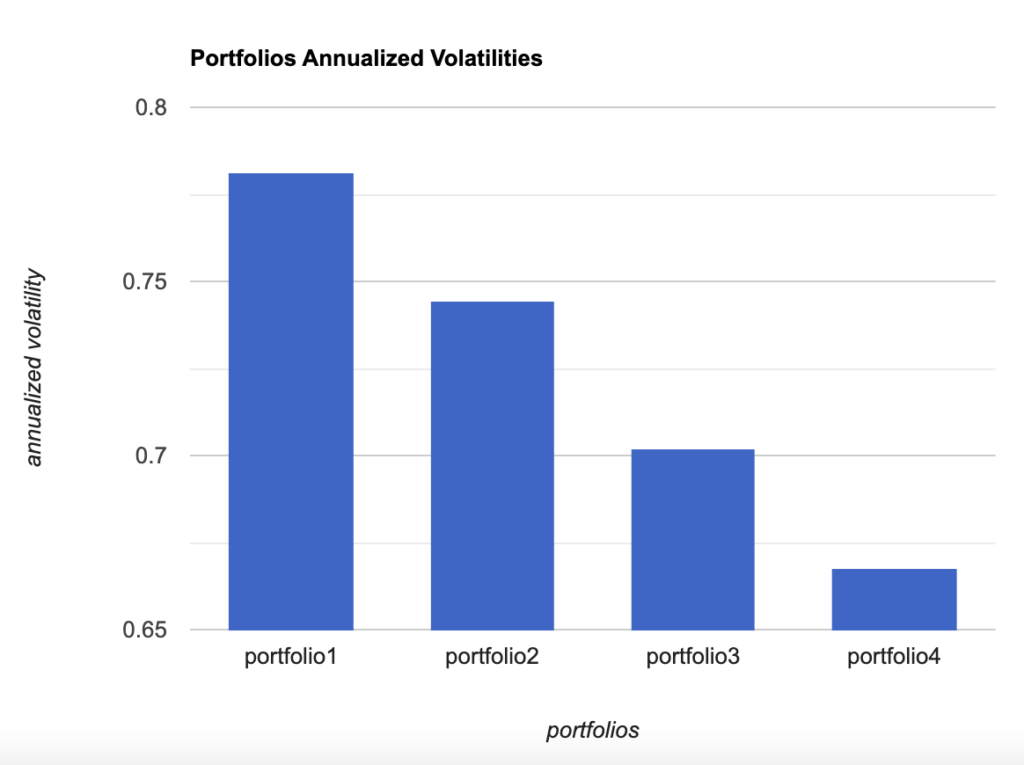
4. Conclusion
Surprise, surprise, the more Bitcoin you have in your portfolio, the lower the annualized volatility of your portfolio.
If you want to minimize risk at any cost, you know what to do: increase your exposure to Bitcoin.
The real question that will come in an upcoming article (that will probably look like our stocks machine learning model) is how to minimize the risk-adjusted-returns.
There is an optimal risk-return frontier that can be discovered by generating a myriad of virtual portfolios based on random assets weights via Montecarlo simulations (blue points):
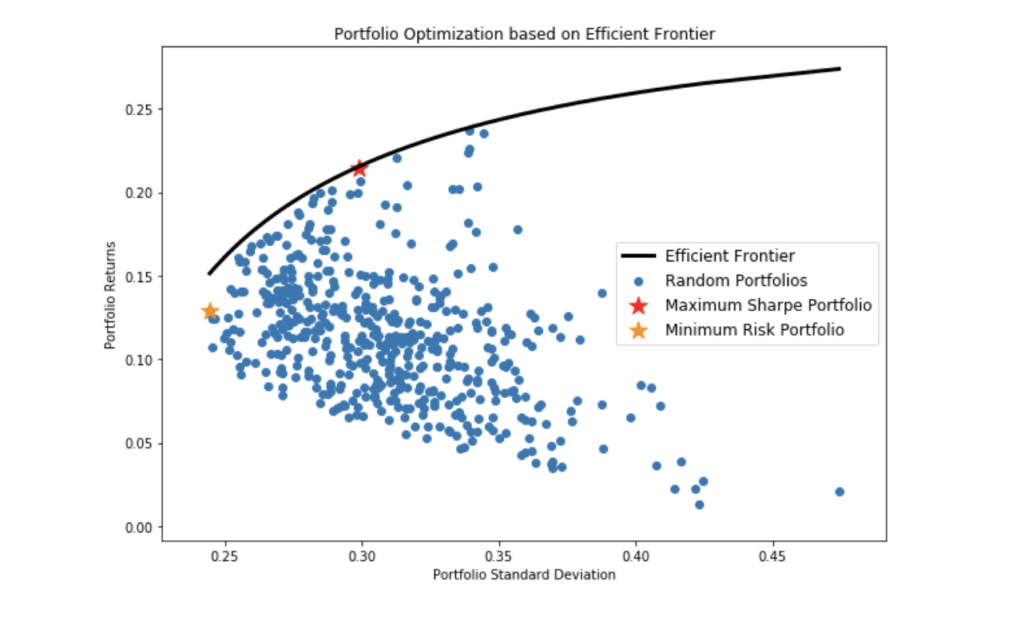
How to find that black frontier? What does it mean to be on it? Where exactly should you be on it depending on your risk appetite? Stay tuned for more crypto volatility content in Python.
Thanks for reading.
n.b: this is not financial advice
