
This article is presenting a machine learning algorithm called “random forest” implemented to evaluate the best indicators for altcoins to look at when investing.
First things first, what is a random forest?
Random forest (also referred to as random decision forest) is an ensemble of decision trees used in common ML tasks such as classification and regression. The idea of a random forest was first proposed by Tin Kan Ho out of AT&T Bell Labs in the mid-90s.
In the context of this article, we’d like to use a random forest model to predict future altcoin dominance using BTC data (just like we did for stocks in this article). Let’s see if the model can generalise well enough to give good predictions in an unseen dataset.

1. The Dataset We Considered
First, we start with daily BTC data and BTC dominance % since 2018 and derive altcoin dominance by simply taking 100 – (BTC dominance %). From here on, we have a time-series of BTC and altcoin dominance as the potential target variable.
Then, the BTC and altcoin dominances of the day may not be the most useful to retail investors, besides, one can get BTC dominance just by taking (supply x BTC price) / (total market cap). To make things interesting, let’s reframe the question to: Can we predict the *future* rise of altcoin dominance, say between a 1-day and 30-day horizon?
Eventually, to prepare our dataset, we “shift” our target variable `altcoin_dominance` by 1, 7, 15, and 30 days ahead to create `altcoin_dominance_1` , altcoin_dominance_7 etc.
Finally, since we are only interested in the change between `altcoin_dominance_X` and today, we define the dominance delta by substracting `altcoin_dominance_X` with the altcoin dominance index at each corresponding time step. This gives us the final target variables `altcoin_dominance_X_delta`, where X is the number of days ahead.
2. The Data Points Used in Our Analysis As Indicators For Altcoins
Below is the subset list of features used and their definitions:
price: BTC daily closing price
btc_market_cap: BTC market capitalisation
daysTillHalving: days remaining until halving
s2f_ratio: Stock-to-Flow Ratio of BTC
mining_revenue: Daily miner total revenue
hash_rate_mean: Average estimated number of hashes per second produced by the miners in the network
fees_mean: Mean fee per transaction excluding newly minted
new_address: New addresses added
transaction_rate: total number of transaction
rsi: Relative Strength Index
roc_momentum: Price Rate Of Change 12D
ema_X: Exponential moving average N-Days
altcoin_dom: Altcoin dominance index
f_g_label_Y: Fear and Greed Index, where Y is Fear and Greed state; True or False
altcoin_dom_X_delta: Altcoin dominance increase/decrease, with X { 1, 7, 15, 30D}
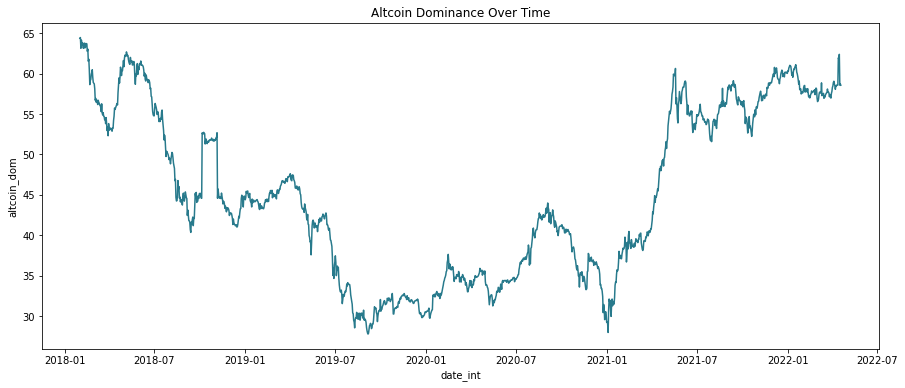
3. Visualising Altcoin Dominance
First, let’s plot out altcoin dominance from the beginning of 2018 to early April 2022 (at the time of writing). The correlates with ETH and altcoin boom in Q1 2021 as one may expect.
Then, the second plot shows us how our dataset moves with altcoin dominance:
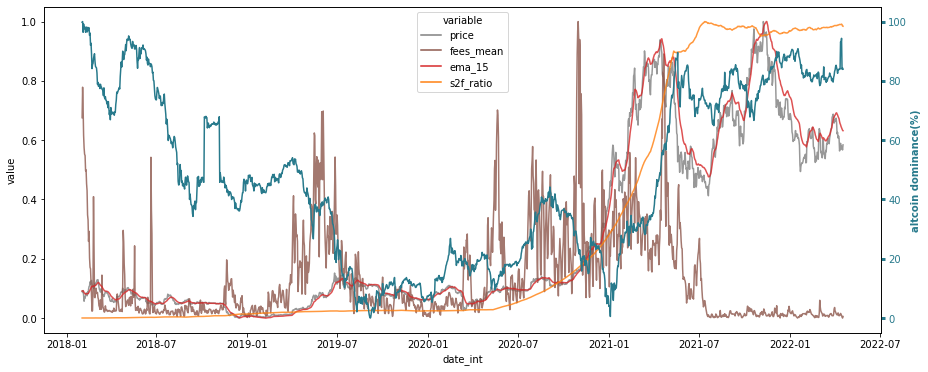
What can constitute good indicators for altcoins?
4. Predicting the Next Day Altcoin Dominance
Here comes the fun part: given the 30 or so data points of BTC on a given day, can we predict if altcoin dominance is set to increase in the next 24 hours?
    Training RF on altcoin_dom_1_delta as target
    Fitting 4 folds for each candidate..

    MAE:  0.416
    r2:  0.017
    dataset IQR**: 0.60
The mean error on the unseen dataset in the 1-day is absolutely terrible at 0.43 for target data with IQR of 0.60. Secondly, we see a near-zero R2 value, a sign of poor fit.
A low R2 value implies a poor “goodness of fit” in the model. A high R2 score indicates that our predictions could approximate the desired real data points. In a perfect scenario, an R2 of 1 indicates that the regression predictions are a perfect fit.
Having a holdout dataset simulates a real-world situation where we will be making predictions on an unseen dataset and is a reasonable way to assess how well the ML models generalise on unseen data.
For example, depending on what type of trading/investing approach, % change in daily dominance may not be the most insightful. Next, we take a look at a using random forest to predict longer horizons of +7 days, 15 days, and 30 days:
    Training RF on altcoin_dom_7_delta as target
    Fitting 4 folds for each candidate..

    MAE:  0.796
    r2:  0.594
    dataset IQR: 1.74
    Training RF on altcoin_dom_15_delta as target
    Fitting 4 folds for each candidate..

    MAE:  0.829
    r2:  0.821
    dataset IQR: 3.11
    Training RF on altcoin_dom_30_delta as target
    Fitting 4 folds for each candidate..

    MAE:  0.761
    r2:  0.934
    dataset IQR: 4.95


5. Conclusion
First, our random forest models perform best in predicting altcoin dominance in 30-day and 15-day horizons in our mini-experiment to find the best indicators for altcoins.
In addition, we also see measurable under-predictions when comparing predicted vs actual – an expected behaviour of a random forest model. This is where random forest has its limitation – if it’s any consolation, over-exuberance is not always a good thing in investing/trading…
Some conclusions:
–S2F ratio, altcoin dominance trend, and EMA-15 are the most influential features on the 15-day model.
-Altcoin dominance, daysTillHalving (DTH), and S2F ratio are more important in the 30-day model.
Some assumptions regarding indicators for altcoins, based on the results:
1. It seems that the days-to-halving becomes increasingly important as the investment horizon becomes longer. I.e: if you’re a long-term investor, it seems to be sensible to buy altcoins just before a halving.
2. The EMA to look at depends on your time horizon. i.e: if you’re a long-term investor, look at 400-week EMA (BTC). For day trading, the 15-day EMA (BTC) is a good candidate.
3. The stock-2-flow ratio is an important indicator for both short term and long term predictions on altcoins.
i.e: look at the stock-2-flow deflection before investing.
4. The altcoin dominance itself is a good parameter to predict the altcoin dominance.
i.e: when this ratio is in all-time-high zone, it’s time to sell altcoins for Bitcoin and the other way around.
Of course, the random forest experiments are far from perfect, but knowing the main features used by the RF models in predicting future altcoin dominances is still a useful insight.
Let us know what you think, do BTC’s days-to-halving and S2F ratio drive investors’ activity in altcoins?
Bye for now.
*The above analysis is not financial advice
** IQR – Interquartile Range
