
How to monitor the adoption of NFT projects and small crypto tokens? Just for fun, I’ve built a Twitter CRON that monitors Twitter accounts followers to evaluate the speed of adoption of a given collection. It’s a way to decide if I invest in NFTs (like I did with altcoins here) at that moment:
How to build this type of dashboard? In this article, I’m sharing the steps.

1. Get your Twitter API key
You can get an API key and secret for free here:
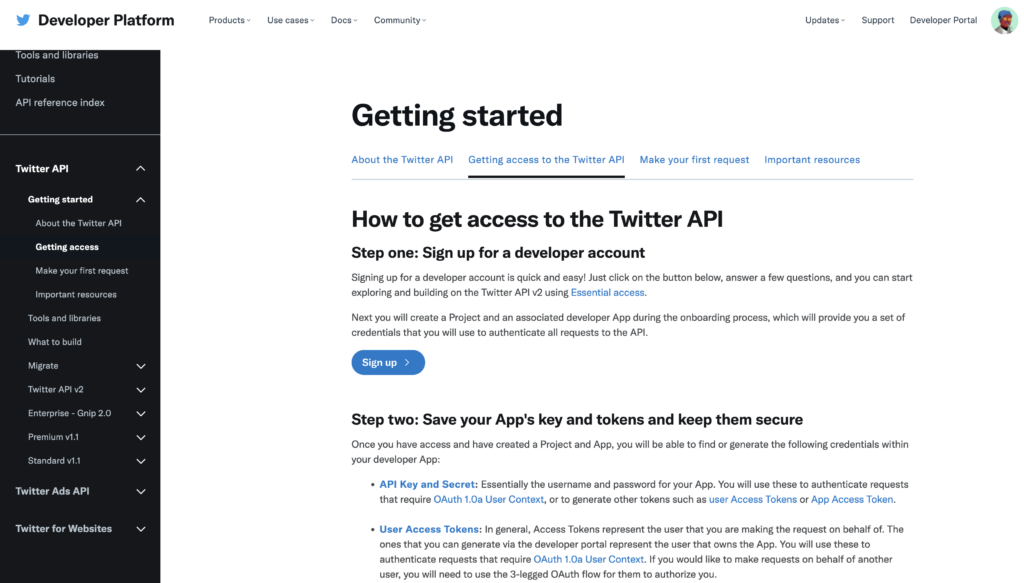
You can do a quick start here.
2. Define a list of Twitter accounts to monitor
A couple of months ago, I’ve decided to monitor the following accounts:
tweeters = ["larvalabs",
            "artblocks_io",
            "BoredApeYC",
            "0n1Force",
            "MyCurioCards",
            "ParallelNFT",
            "Pudgy_Penguins",
            "coolcatsnft",
            "KoalaAgencyNFT",
            "punkscomic",
            "satoshibles",
            "GoonsNft",
            "Aworld_NFT",
            "DropBearsio",
            "alcabonesNFT",
            "Atomicantznft"]
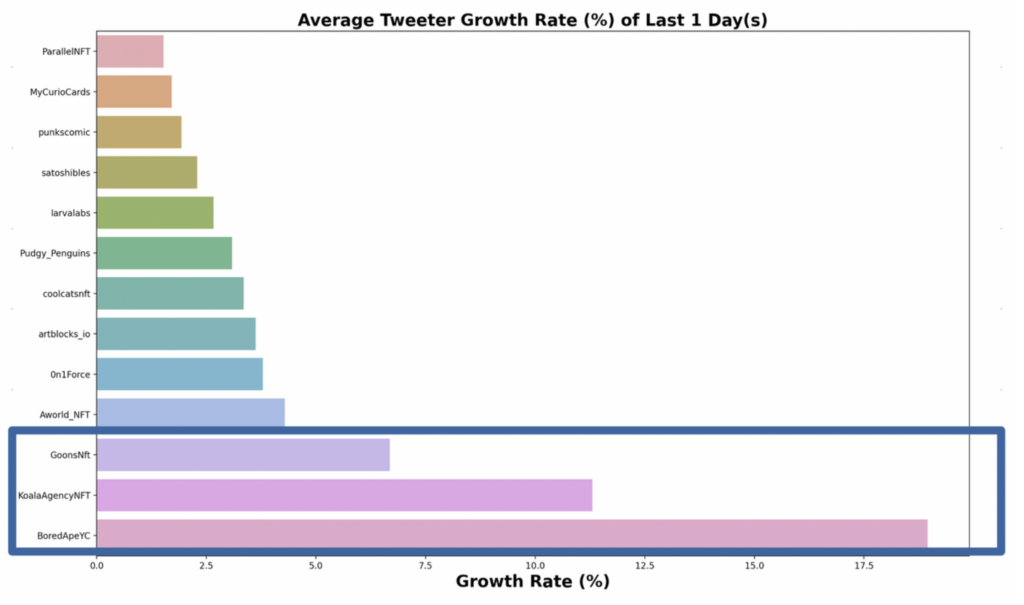
Are they growing? Which one is growing faster? A good way to verify this is to compare the Twitter followers of accounts between 2 given days and measure the adoption slops of the different collections during a couple of weeks.
3. Write a CRON in Python to fetch the data daily in CSV
Replace your API secret and your API key in the script:
import tweepy,csv, datetime


class Fetch:
    """
    Class in charge of fetching data for a list of NFT projects.
    """

    def __init__(self):
        """
        Setting up all the data needed for reporting.
        """

        self.tweeters = ["larvalabs",
                         "artblocks_io",
                         "BoredApeYC",
                         "0n1Force",
                         "MyCurioCards",
                         "ParallelNFT",
                         "Pudgy_Penguins",
                         "coolcatsnft",
                         "KoalaAgencyNFT",
                         "punkscomic",
                         "satoshibles",
                         "GoonsNft",
                         "Aworld_NFT",
                         "DropBearsio",
                         "alcabonesNFT",
                         "Atomicantznft"]


    @staticmethod
    def _get_tweeter_subscribers(username):
        """
        Getting the number of followers of the account.
        :param str username: the tweeter username of the project.
        :return int followers: the number of followers of the account.
        """
        consumer_key = ""
        consumer_secret = ""
        access_token = ""
        access_token_secret = ""
        auth = tweepy.OAuthHandler(consumer_key, consumer_secret)
        auth.set_access_token(access_token, access_token_secret)
        api = tweepy.API(auth)
        user = api.get_user(username)
        return user.followers_count

    def write_csv(self):
        """
        Write CSV with the tweeter count of each project for a given date.
        """
        time = datetime.datetime.now().strftime("%Y_%m_%d-%I_%M_%p")
        filename = 'reports/' + time + '.csv'
        with open(filename, 'w') as file:
            writer = csv.writer(file)
            writer.writerow(["project", "tweeter_followers"])
            for project in self.tweeters:
                writer.writerow(
                    [project, self._get_tweeter_subscribers(project)])

def start():
    """
    Start the application
    """
    fetch = Fetch()
    fetch.write_csv()

if __name__ == '__main__':
    start()
I’ve been running this every day for a while as a CRON job.
4. Plot the results
You want to see the results? You need a script scanning the CSVs and plotting:
import tweepy,csv
import matplotlib.pyplot as plt
import seaborn as sns

class Plot:
    """
    Class in charge of plotting the data for NFT projects.
    """

    def __init__(self):
        """
        Setting up all the data needed for reporting.
        """
        self.tweeters = ["larvalabs",
                         "artblocks_io",
                         "BoredApeYC",
                         "0n1Force",
                         "MyCurioCards",
                         "ParallelNFT",
                         "Pudgy_Penguins",
                         "coolcatsnft",
                         "KoalaAgencyNFT",
                         "punkscomic",
                         "satoshibles",
                         "GoonsNft",
                         "Aworld_NFT",
                         "DropBearsio",
                         "alcabonesNFT",
                         "Atomicantznft"]

        self.files = ['reports/2021_08_29-12_00_AM.csv',
                      'reports/2021_08_30-12_00_AM.csv']
        self.followers = {}
        self.growth = {}

    def load_project_followers(self):
        """
        Load followers.
        """
        for file in self.files:
            with open(file, 'r') as file:
                for line, row in enumerate(csv.reader(file)):
                    if line == 0:
                        continue
                    try:
                        self.followers[row[0]].append(row[1])
                    except KeyError:
                        self.followers[row[0]] = [row[1]]
        return self.followers

    def get_growth_rate(self):
        """
        Get average growth rate.
        """

        for project, followers in self.followers.items():
            init_followers = followers[0]
            growth_rate = 0
            for follower in followers[1:]:
                growth_rate = (float(follower)/float(init_followers)-1)*100
            self.growth[project] = growth_rate

    def plot(self):
        plt.xlabel("Growth Rate (%)", weight='bold', fontsize=19)
        plt.title("Average Tweeter Growth Rate (%) of Last 1 Day(s)", weight='bold', fontsize=19)
        plt.rcParams["axes.labelsize"] = 35
        ordered_growth = {k: v for k, v in sorted(self.growth.items(), key=lambda item: item[1])}
        projects = []
        growths = []
        for project, growth in ordered_growth.items():
            projects.append(project)
            growths.append(growth)
        sns.barplot(growths, projects)
        plt.show()


if __name__ == '__main__':
    plot = Plot()
    plot.load_project_followers()
    plot.get_growth_rate()
    plot.plot()
It gives the following type of growth chart:
5. Conclusion
You can identify projects getting adoption based on social medias monitoring using programmatic tools like APIs. It’s a good way to know if you should invest in NFTs at that moment. 6 months ago, BAYC was getting the most intense traction on Twitter, based on the chart above. Since then, the price of the collection did a 2x in the middle of a NFT bear market.
Thanks for reading.
Disclaimer: this is not financial advice
